Archives for January 2007

Iconix Brand Group (ICON)

Stock of the Day
Iconix Brand Group
Wednesday’s Close: ICON – 20.81

011107_icon_weekly_sm.png

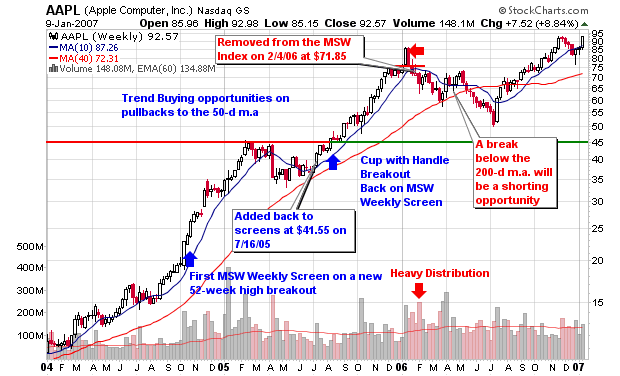
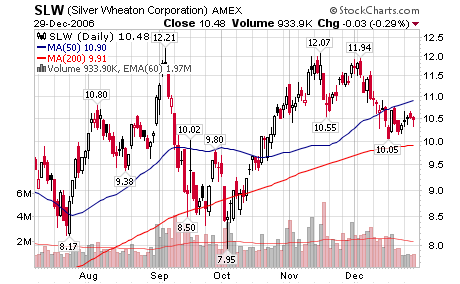
The ideal entry for this stock is near $17.50 – $18.00 or preferably the 200-day moving average. Volume has been increasing as the stock has been trending higher over the past 18 months. I do expect a consolidation period before the next advance but that is just my opinion. Let the charts tell you what is happening. Many young stocks pause and consolidate in the low $20 range before moving on to make large advances. Not all stocks follow this pattern so the best advice is too monitor the daily and weekly charts and locate support and resistance levels which can help you determine the best entry and exit areas based on probable risk ratios

(From Yahoo) Iconix Brand Group, Inc., a brand management company, engages in owning, licensing, and marketing a portfolio of consumer brands, including Candie’s, Bongo, Badgley Mischka, Joe Boxer, Rampage, Mudd, London Fog, Mossimo, and Ocean Pacific. The company licenses its brands through approximately 115 retail and wholesale licenses worldwide for use in connection with various product categories, including women’s, men’s, and children’s apparel, footwear, and accessories; home furnishings; and beauty and fragrance. The company was founded in 1978. It was formerly known as Candie’s, Inc. and changed its name to Iconix Brand Group, Inc. in 2005. Iconix Brand Group is headquartered in New York, New York.

Next Earnings: 3/7/2007
Sector: Consumer Discretionary
Industry: Footwear

Inside Ownership: 24.80%
Held by Inst.: 48.08%

Number of Institutions:
Money Market: 106
Mutual Fund: 123
Other: 8

Top Holder: BAMCO Inc.
2.5mil shares for 0.02% of Portfolio
Total Equity Value of Portfolio: $16.0 billion

Interesting Institutional Facts:
Value of Shares bought last reporting period: $239,381,225
Value of Shares sold last reporting period: $45,501,443

Key Fundamental Numbers:
Short Ratio: 4.84
Debt $M: 145.17
Operating Margin: 42.76
Net Income $M: 31.13
ROA (%): 9.79
ROE (%): 19.74
Free Cash Flow $M: 21.39
P/E (TTM): 28.44
P/E (Forward): 20.33
Price to Sales Ratio: 15.98
Price to Cash Flow: 49.60
Earnings per Share (TTM) (EPS): 0.74
Book Value per Share: 2.84
PEG Ratio: 1.13
Price to Book Ratio: 3.85
Debt/Equity: 0.76
Cash Flow/Share: 0.38

Earnings:
Yearly (2005): 0.46
Yearly (2004): -0.45
Yearly (2003): -0.17
Yearly (2002): -0.12

2006:
Q1: 0.18
Q2: 0.19
Q3: 0.18
Q4: —

2005:
Q1: 0.02
Q2: 0.08
Q3: 0.14
Q4: 0.19

Revenue (millions):
Yearly (2005): 30.16
Yearly (2004): 131.4
Yearly (2003): 156.8
Yearly (2002): 101.4

2006:
Q1: 13.27
Q2: 18.41
Q3: 22.11
Q4: —

2005:
Q1: 4.30
Q2: 4.29
Q3: 9.21
Q4: 12.36

Net Income:
2005: 15.9
2004: -11.3

Cash:
2005: 12.2
2004: 2.79

011107_icon_daily.png

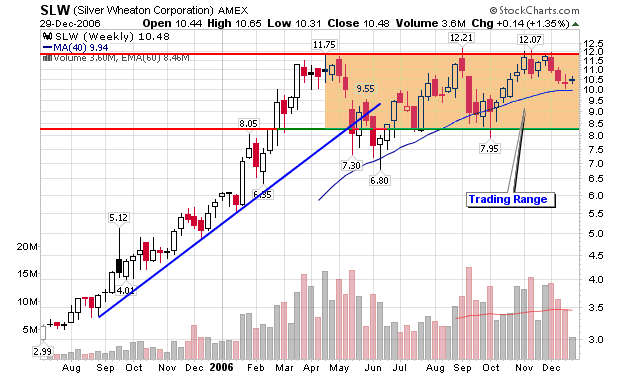
The stock has been trending in a nice channel as Yaser Anwar points out in a comment on a previous post titled Stock Predictions for 2007 – Oh NO! ICON was highlighted as one of the stocks I was watching for possible purchase in 2007. It would be nice to hear Howard’s thoughts too as he is a strong believer in buying stocks making new highs or at least near new highs. That is my bread and butter strategy and it has not failed me yet (over the long term).
Disclosure: I do not own Shares in ICON as of 1/11/07

Apple Inc. is Still Green

What can I say; the apples keep getting greener! Apple Inc (the new name) unveiled its new iPhone and AppleTV yesterday as the stock was up over 8%. As you all probably know by now, it’s more than just an 8 gigabyte iPod mobile phone with a touch-screen. It looks great; sharp and sleek with internet capabilities that have me salivating. One problem for me though: I don’t use Cingular and I am not changing my carrier because my service has been excellent for five straight years so I’ll stick with my razor and traditional iPod for now.

011007_green_apples.jpg

I have not owned Apple shares in a long time but it was a stock that I owned on multiple occasions in late 2004 and throughout much of 2005. I finally sold my shares in late 2005 and wrote this to all MSW members in early 2006:

011007_appl_sm.png

Saturday, February 4, 2006 – MSW Index:
APPL – 71.85, Apple is still struggling below the moving average but has not violated the major support level of $70. It will be removed from the MSW Index if it breaks the $70 support. Rating: Hold (sell below $70 – buy if it holds)

Monday, February 6, 2006 – MSW Daily Screen:
Apple Computer (AAPL) has been cut from the MSW Index as it violated the support line on volume 100% larger than the 50-d m.a. with a 6.33% drop. I hope many of you also cut your positions when the red flags started to pile up. If not, I strongly suggest cutting the stock and locking in profits before the stock drops further.

NOTE: the stock dropped 30% over the next five months and took more than eight months to break even but it did. It is now almost 30% higher than the violation date back in early 2006. I would be showing a larger profit if I were a buy-and-hold investor but maybe I would have never bought LVS in April without this Apple cash. I just can’t watch a position go against me no matter the long term results. I don’t buy and hold – maybe some day!

One of my earliest blog posts was about Apple back on January 13, 2005 and I titled the post “Green Apples”.

I followed up that post with one titled: All-Star Stock – Digesting Apple on January 17, 2006.

011007_iphone.jpg

It’s a great company and a great stock, let’s see where it goes.
Disclosure – I do not own shares in Apple and I don’t plan to buy in the near future.

Do Not use Fundamental Analysis Alone!

Most people reading this blog already know the differences between fundamental and technical analysis so I will not go into too much detail on each subject. However, new readers and novice investors may still be confused and that is completely understandable since many main stream analysts still focus on “the numbers” rather than the charts to determine their entry and exit decisions. Don’t get me wrong, I study the numbers and focus on investing in companies that actually turn a profit but the fundamentals don’t help me with my decisions of “when to buy” and “when to exit”. The foundation of my system is based on a CANSLIM philosophy that integrates fundamental and technical analysis. So please – take it easy value and buy-and-hold investors. We all know that there is no “ONE WAY” to invest successfully.

Click_to_Enlarge

To start, turn on any major network news station and you will become bombarded by fundamental analysis and strong opinions based on fundamental numbers and nothing else. It’s the strong opinions that bother me more so than the actual dissection of the company’s balance sheet. Occasionally I will see a basic line chart posted on the screen that highlights the recent history of prices but it is presented without any study or analysis from the “talking head”. In addition to not focusing on charts, these analysts tend to concentrate on the same mega stocks each and every day (the most famous blue chip stocks or stocks of the past as I like to call them). It disturbs me that the “buy and hold” strategy is still the predominate scenario discussed on the major news networks and newspapers across the nation. Yes, buy-and-hold still works for some investors but it has cost many more large profits in the market because they believe their portfolio is doing well because it is always compared to the averages.

They tell you on Wall Street that you had a great year if your portfolio only lost 10% because the DOW and S&P 500 lost 20%. You beat the averages – they will tell you. What a bunch of crap because the entire purpose of investing is to make a profit and grow your net worth. I am not doing this to lose money and pat myself on the back that I only lost half as much as the averages. I’ll leave that thinking for the bozo’s of the world.

Reading corporate financial statements is an excellent skill for every investor but making short term buy and sell decisions based from this information can be costly. In my opinion (yes, my opinion), a short term trade is less than one month but I focus on intermediate trades which can typically be held from a few weeks to several months based on the action in the stock.

010807_bozo.jpg

What most “average” bozos don’t realize is that a stock price usually breaks down well before the actual fundamentals turn negative and the official negative news hits the street. Reading about the Dow Theory could have given you this small piece of advice and that theory was written over 100 years ago. Insiders always start to sell when things are looking down or sales are not expanding. This poses a problem for the individual investor because they won’t know about poor sales or earnings until the official news is published or the company changes their outlook in a conference call, months after the problem has already developed. Look at the Home Building Industry for a perfect example. None of these companies reported losses until this year yet their stocks started to drop considerably, early last year. Toll Brothers (TOL) and KB Home (KBH) are used as examples in this post.

Click_to_Enlarge

You may now ask: How can I sell before the fundamentals turn negative?

It’s called technical analysis, a study of chart patterns that allow the investor to determine if a company may be heading in the wrong direction or sideways pattern after an extended up-trend. Fundamentals make you aware of a particular stock to purchase as sales and earnings are rising quarter over quarter and year over year but they don’t get you out of the stock before the floor drops. Just because a company has excellent earnings or a perfect track record, doesn’t mean you buy immediately. You may be buying after an extended up-trend while the stock is due for a correction before its next up-trend. Nobody knows how long a correction will last; it can be 8 weeks, 8 months or 18 months. Why would you park your money in an investment that is stagnant or can possibly lose money for an extended period of time even though the bottom line is pretty? This is a common buy and hold strategy that the analysts tout to novice investors.

Technical analysis can help investors spot red flags such as distribution days, breaking of support lines or the violation of key moving averages. Pure Fundamental investors will not sell or even be aware of the current situation on the charts leaving them vulnerable to costly drops in price that may take years to recuperate. The talking heads of the media may still recommend a particular stock with a high risk chart formation only because they don’t understand that all key fundamentals are priced into the stock six months in advance. The technical investor will see the trouble arising and can take action well before the “bad news” hits the street. The technical investor won’t know what this bad news will be but they know it won’t be positive and that is the most important fact.

When technical red flags are flashing in all directions; sell and wait to see how the stock is going to react and what news is on the horizon. Sooner, rather than later, negative news will come out from the company stating that sales have slowed, a contract was lost, a drug was not approved, or maybe the CEO is resigning. Whatever the negative news may be, as soon as it hits the headlines, fundamental analysts will be talking their heads off at how it may be time to sell (even though the stock is now many percentage points below the key sell signals flashed on the charts). The stock has usually dropped dramatically by this point but the numbers have not been updated until now, the time the whole free world can now sell for a significant loss. On the other hand, the buy and hold investor will usually just hold and claim that they broke even or made a profit several years in the future. Who cares if you make 25% or 50% over a 5 or 10 year period. Don’t allow a loss of 10% snowball into a 50% drop in your portfolio. Stocks such as Microsoft may take another 5 years or more just to break some investors even from 2000. That would make 10 years or more for the poor sole that bought in the bubble burst of 2000.

I use both fundamental and technical analysis to make decisions in the market and believe that both tools give you an advantage over the investor that only uses one of these tools. It’s just a matter of how, when and where each of these tools are used that can add to your overall success.

Medical Properties Trust Inc. (MPW)

Stock of the Day
Medical Properties Trust, Inc. (MPW) operates as a real estate investment trust (REIT) in the United States. The company acquires and develops healthcare facilities, and leases the facilities to healthcare operating companies. It also makes mortgage loans to healthcare operators secured by their real estate assets. The company’s facilities include rehabilitation hospitals, long-term acute care hospitals, regional and community hospitals, women’s and children’s hospitals, and ambulatory surgery centers, as well as other ancillary facilities.

**Click Chart to Enlarge**
010407_mpw_thumb.png

MPW – 15.15
A young lower priced stock that has had a few interesting down days but the overall trend has been higher. Volume has been increasing and major support seems to sit lower at the 200-d m.a. Shorter term entry area and support is near the 50-d m.a. but I would ideally want to enter near the 200-d m.a. after or during a nice consolidation phase.

The year over year earnings and revenue growth is what catches my eye with this young, lower priced stock. Further expansion and acquisitions will fuel future growth and this seems to be the model the company is taking.

The shares in MPW provided a 7.8% dividend yield which is above the 5.8% peer average.

2006 Return: 67%
52-week Range: $15.65 – $9.40

Earnings:
2007:
Estimate: 1.03

2006:
Q1: 0.20
Q2: 0.20
Q3: 0.22
Q4: 0.27 (E)
Yearly: 0.89 (E)

2005:
Q1: 0.14
Q2: 0.17
Q3: 0.14
Q4: 0.16
Yearly: 0.61

Revenue (millions):
2006:
Q1: 12.69
Q2: 13.16
Q3: 15.12
Q4: —
Yearly: —

2005:
Q1: 6.48
Q2: 7.24
Q3: 8.21
Q4: 9.62
Yearly: 31.55

Institutional Ownership: 66%
Market Cap (B): $0.615

Net Income:
2005: 19.6
2004: 22.4

Cash:
2005: 59.1
2004: 42.7

010407_mpw_daily.png

Number of Institutions:
Money Market: 88
Mutual Fund: 133
All Others: 3

Top Holder: Cohen & Steers Capital Management, Inc.
2.2 mil shares or $33.5 million, 0.1% of portfolio
Total Equity Value of Portfolio: $20.5 billion

It’s a small company with a small portfolio but with growth, increased leverage and additional acquisitions, the stock has room to grow. My ideal entry is closer to the 200-d m.a. or after the first consolidation phase from new 52-week highs (as long as it holds support).

Silver Wheaton Corporation (SLW)

Stock of the Day – Case Study

Silver Wheaton Corporation
Silver Wheaton Corp., a mining company, engages in the silver production. It purchases silver from Luismin mines in Mexico and the Zinkgruvan mine in Sweden, as well as purchases silver from the Yauliyacu Mine in Peru.

010307_slw_daily.png

SLW – 10.48
The young stock is showing solid support above the 200-d m.a. with a breakout above $12.21 (resistance zone above $12 as shown in the weekly chart). The ideal entry is a move above $12.50 on the point and figure chart. Some may consider the current area an entry along the 200-d m.a.

Support also sits above $8 if the stock happens to violate the 200-d m.a. This support dates back to the trendline violation in May 2006.

2006 Return: 81.3%
52-week Range: $12.21 – $5.54

Earnings:
2006:
Q1: 0.07
Q2: 0.11
Q3: 0.09
Q4: —

2005:
Q1: 0.03
Q2: 0.04
Q3: 0.04
Q4: 0.04
Yearly: 0.15

2004:
Yearly: 0.02

**Click Image to Enlarge**
010307_slw_weekly.png

* All numbers in Millions
Revenue (yearly):
2006:
Q1: 25.17
Q2: 47.41
Q3: 41.77
Q4: —

2005:
Q1: 16.08
Q2: 19.26
Q3: 18.08
Q4: 17.47
Yearly: 70.90

2004:
Yearly: 10.99

ROE: 12.1%

Net Income:
2005: 25.3
2004: -0.05

Cash:
2005: 118
2004: 0.32

Cash Flow:
2005: 31.3
2004: 0.74

Number of Institutions:
Money Market: 69
Mutual Fund: 28
All Others: 5

Top Holder: Capital Research and Management Company
2.5 mil shares or $26 million
Total Equity Value of Portfolio: $554 billion