Stock of the Day
Home Inns & Hotels Management Inc.
Tuesday’s Opening Price: HMIN – $33.50
Sector: Leisure
Industry: Hotels and Motels
52-week Price: $21.50 – $49.50
My Take:
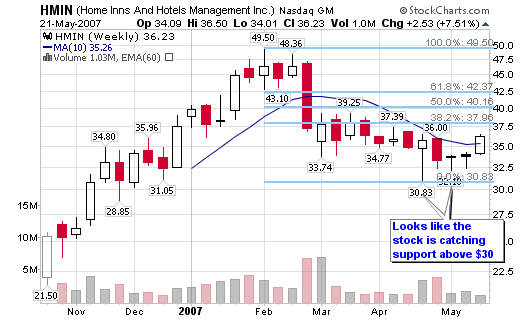
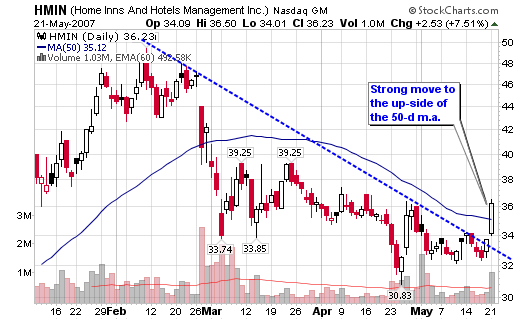
The stock blasted 7.51% higher yesterday on above average volume as it confirmed the move above the down-trend line and recovered the 50-day moving average for the first time since late February. As you will read below, the earnings released yesterday were positive and revenues increases by 65% (year-over-year).
The young stock has not formed a 200-d m.a. to date so we can only use the data available to make a trading decision. The recovery of the 50-d m.a. is positive and gives us the green light to set-up a trade and take a potential position. Ideally, the position should have been initiated near $34 but I had to wait until earnings were released, especially for a China based stock (the risk levels are increased with companies from this country).
Institutional support is increasing (see figures below) and most fundamental categories look solid. The P/E ratio is extremely high but that doesn’t scare me too much. High growth will cost more but it is an indicator to keep an eye on. I wouldn’t expect a value investor to give this stock a second look based on P/E alone.
Potential Trade Set-up:
- I would risk between 0.005% and 0.01% of your total portfolio
- My ideal entry would be near $34.
- Set a stop loss of 10% (near $30.60).
- Target price will be about $42 or the 61.8% Fibonacci level on the weekly chart. An aggressive target will be a full retracement to close the cup shaped pattern above $46.
- At $42, the risk-to-reward will be just above 2-to-1 (not great)
- At $45+, the risk-to-reward rises above 3-to-1 which is what we want as a minimum.
So, a $100,000 account will give you
Entry: near $34
1% Risk: $1,000
Stop Loss: 10%
Position Size: $10,000
Shares: 290
Stop Loss: $30.60
Target: $42-$45
5/21/07: First Quarter 2007 Financial Results
For the first quarter of 2007, Home Inns reported total revenues of RMB183.1 million (US$23.7 million), representing a 65.5% increase year-over- year.
Total revenues from leased-and-operated hotels for the first quarter of 2007 were RMB174.6 million (US$22.6 million), representing a 60.7% increase year-over-year. The Company opened 3 new lease-and-operated hotels during the quarter.
Total revenues from franchised-and-managed hotels for the first quarter of 2007 were RMB8.5 million (US$1.1 million), representing a 327.0% increase year-over-year. The Company opened 8 new franchised-and-managed hotels during the quarter.
Net income for the quarter was RMB3.0 million (US$0.4 million). Net income was reduced by the non-recurring charge of RMB6.1 million (US$0.8 million) for re-measurement of net deferred tax assets, foreign exchange losses of RMB6.1 million (US$0.8 million) and share-based compensation expenses of RMB1.7 million (US$0.2 million).
Institutional Analysis:
Held by Institutions: 14.95%
Money Market: 49
Mutual Fund: 28
Other: 1
Shares Held: 4.86M
Shares Held Previous Period: 0.53M
Shares Bought: 4.68M
Shares Sold: 0.35M
Value of Shares Bought: $166.0M
Value of Shares Sold: $12.5M
Top Institutional holders, Shares Held:
Driehaus Capital Management, Inc., 869,833
First State Investment Management Uk Ltd., 451,000
Gilder, Gagnon, Howe & Co., 449,667
Schroder Investment Management Group, 431,800
Fidelity International Ltd (Bermuda), 319,200
Key Fundamental Numbers:
Market Cap.: $1.2B
Outstanding Shares: 34.7M
P/E (TTM): 162.84 (wow)
P/E (Forward): 140.42 (another wow)
Price to Sales Ratio: 17.38
Price to Book Ratio: 10.26
Gross Profit Margin: 27.2%
Operating Profit Margin: 13.45%
Net Profit Margin: 9.36%
EPS Growth: 26.45%
Revenue Growth: 80.29%
3-Year Earnings per Share Rate: 91%
3-Year Sales Rate: 240%
Earnings:
Yearly (2008): 0.53E
Yearly (2007): 0.27E
Yearly (2006): 0.05


Chris, I want to let you know that I truly enjoy reading you posts. The information is thorough and concise. A couple of questions:
*How do you determine to risk/reward?
*Do you pay attention to sector rotation? I pose the question b/c in an earlier post I asked you on your thoughts on several stocks in the paper sector (VCP, KAI for example)
*In these recommendations, do you suggest margin be used or is that a decision that should be based on personal choice/market condition?
Thanks again.
Albert,
Risk to reward is based on the stop (in this case about 10% or $3.40). The target is $42-$45 based on the stock pattern and fibonacci levels.
So, add $3.40 to $34 to equal risk to reward. Risk is $3.40 and a target of $42 gives us a possible (only possible) reward of 2.35: Risk to reward is 2.35-to-1.
$42-$34= $8
$8 / $3.4 = 2.35
At $45, the risk to reward is 3.23-to-1.
If you change the stop, the risk to reward will change. Hope this helps.
I do pay attanetion to sector rotation and HMIN is in a weak sector right now so keep that in mind.
Margin should only be used in bull type markets. As long as risk is controlled, margin can be used.
Chris, thank you for your post on this stock. Informative and educational as usual.
I have a question on how you select stocks to evaluate? I mean, there are too many stocks out there to possibly have time to analyze each one individually.
Even on IBD you have IBD100, CANSLIM select, Stocks on the Move, Industry Groups. Do you use some screener (if so, which site/tool?), and what criteria do you use?
Thanks again.
Chris,
Stumbled actross your site, can’t wait to pour over it.
Question: is Driehaus involved in Amerisuites?
Kevin,
I checked their complete holdings and didn’t find Amerisuites. Do you have a ticker of this company or the parent company?