I was doing some research last night and was reviewing the final MSW Index before closing the site for a new format. The MSW site closed in March and my final weekly analysis was done on 3/3/07. The MSW Index included a total of 21 stocks at the time with six of the stocks still around from 2006. Many new names were on the index with several of them highlighted here on the chrisperruna blog in 2007.
Click the Image below for the March 3, 2007 MSW Index PDF
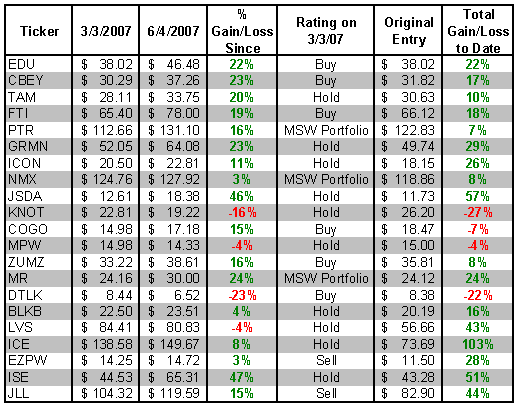
Anyway, I was impressed with the results of the stocks listed on that final Index as I calculated their current gains/losses to date and their overall gains from the original date of coverage. Of the 21 stocks left on that final screen, seventeen of them are currently showing a gain with four of them in the red. Of the four in the red, I actually highlighted one of them as a short on this blog and would have removed it from the index had I continued to run the MSW subscription service (KNOT). Another of the red stocks is LVS which has also been cut to hold/sell in my book and was a superstar on the index in 2006. DTLK was the sole loser in this bunch as the position never worked.
The average gain of the seventeen stocks is 19% with the largest three month total going to ISE at 47%. JSDA was a close second at 46% and you must consider that the stock is far from the highs set in April. Overall, the top gainer from the initial coverage is ICE at 103% from its starting price of $73.69. The average gain from the initial coverage of each stock is 30%, about 5% higher than my target goal in my expectancy calculations.
Of the stocks that are currently up, JLL was my poorest analysis as I labeled it a sell on 3/3/07 when it was trading at $104.32. I initially started coverage when the stock was trading at $82.90 and liked what I saw but the action in March ruffled my feathers. This turned out to be the wrong call as the stock closed at $119.59 yesterday for a 15% gain since March and a total gain of 44% since the initial coverage.
Take a look at the MSW Index link above to see what I was researching at the time and then take a look at the chart in the image below to see how these stocks have performed over the past three months. I know we are in a strong up-trending market so results like these are not difficult to obtain but the win/loss percentage is still impressive for 21 stocks that have not been touched in three months. I don’t know what the MSW Index would look like today but I can assure you that several of these names would still be on the list.
As you know, I have been buying and researching new stocks such as:


I think that JSDA is grossly over valued. I wrote a blog on its peak and I don’t think that one looks pretty at all,
http://makingsenseofmyworld.blogspot.com/2007/04/jones-soda-co-breaking-down-growth.html
And on GROW, the guy that runs that one is very, very good. I saw him speak in January and at the time he was 36% in cash. He keeps the investments current, getting rid of those that have reached premium levels and looks for new ones.
Deborah,
I agree with JSDA, the run was earlier this year and we nailed it!
Chris,
Could you touch briefly on how you determine your the lines you place on stocks you are evaluating to take a position on? I look at these as levels of resistance but you may refer to them differently.
Thanks!
Chris, do you follow Robert Colby’s Top 10 Ranked ETFs? Seems like something that would be of interest. It was just featured in Forbes. Here is a link for you: http://www.TraderEducation.com/forbes/
Keep up the great work. I am new to your blog.
Hi Chris, Is there any way I can link my site to yours? its about the South African Stock market as a alternative investment
http://bluvestments.blogspot.com