Archives for July 2007

NMX Options Sold into Strength

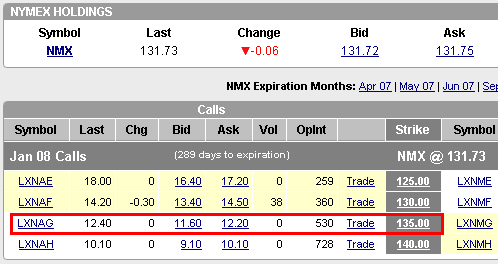
I decided to cut and run with my profits in my Nymex (NMX) call options. Take a look at the two images below to see the difference in prices from April to July in Jan 08 130 Calls. I no longer want to own long term based on takeover rumors that are on and then off. I may start to play the dips and grab more calls if the stock falls once again. Buying puts near the peak can be a play although risk is higher since a buy-out could actually happen.

The Jan 08 130 calls have been swinging between $10.50 and $20.50 over the past couple of months. Not a bad scalp or swing trade without capital needed.

Today’s Opening Prices:
071307_nmx_opt.PNG

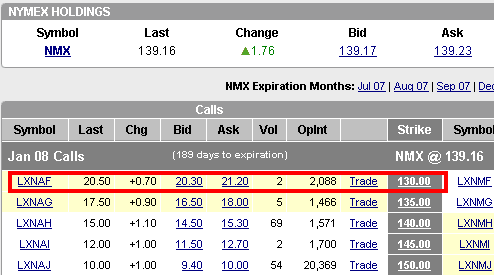
A 52% gain in the Jan 08 130 option premium (I did buy the 130 at $13.50 and not the 135)! However, the stock only gained 6% in actual price as you can see ont he screenshots.

Screenshot from April:
040407_nmx_opt.PNG

Stock of the Day Performance

It’s time for a mid-year review here on chrisperruna.com. I have performed 24 “Stock of the Day” case studies since the start of 2007. Assuming that I was holding every stock to date, the combined portfolio is up approximately 26% with the lead gainer going to BIDU at 98%. The laggard must go to MPW at 12.01% loss. Yes, SHLD is down 12.84% but that is due to poor coverage by me when the stock was extended from a proper support level (besides, it’s more of a value stock than a growth stock so I was out of my league when doing the analysis). Either way, SHLD is a stock I would add long term as a value investor (IRA type stock or one I put into a child’s portfolio).

Keep in mind; the statistics below do not consider sell stops, stop losses, taking profits, etc… I haven’t organized the stocks into a true portfolio so the performance could have been better or worse based on actual trade decisions along the way. JSDA would be a perfect example as the stock reached a peak gain above 148% and is now only showing a gain of 25%. Several of the losers would have been cut quicker than the current losses showing that are greater than 7-10%.

The post is for fun, especially in this excellent up-trending market!

General Statistics:
75% win ratio (18 of 24 stocks showing a gain)
31% Average Winning Trade
7.5% Average losing Trade

97.75% – Top Gainer
12.84% – Worst Loser

149% – JSDA, Top Peak Gainer at High Price

Not bad considering I haven’t used any money management rules to achieve these results.

071207_results.PNG

The Holy Grail of Trading: It’s not your System

Do you have a wonderful trading system, one that consistently makes you money? You probably believe that you have found your holy grail but this couldn’t be further from the truth. Your system has very little to do with consistent profitability in the markets.

I often here amateur investors talk about that the “best way” or “only way” to invest and argue why their way is better than everyone else’s. The passion and energy exuded by these novice investors is wonderful but they are missing the point completely. No one can say that options are better than stocks, commodities are better than options or forex is better than everything, etc… Each investor develops a system that is suited to their own personal character traits and they use a vehicle (stocks, options, forex, commodities, real estate, etc…) that can help them reach their goals.

Investors also debate systems within a market such as: trend trading, swing trading, scalping, shorting, day trading, buy and hold, fundamental trading, technical trading, Elliot wave theory, moving average crossovers, etc… They all work if the “person” understands the holy grail of trading. And that is being able to understand YOU and how your mind works.

However, it is not the system that makes one successful. It is YOU that makes the system work properly. What do I mean? Each individual must master their own personal psychological impacts on their trading results. You must work on YOU to become consistently successful! I recommend reading The Disciplined Trader by Mark Douglas if you would like to understand the psychological trader in you.

To say that one system or vehicle is the “way to go” is ignorant.

Pick up any Market Wizard book and read how these men and women made hundreds of millions in the markets using different systems. The only thing they all had in common was money management and risk management. That’s ALL! Every one of them traded in different ways and used different vehicles but they all watched their risk, calculated proper position sizing techniques and understood their system’s expectancy.

Money management, also termed as risk management is a major part of the holy grail of investing, NOT THE SYSTEM! Novice investors will eventually understand this after many years of trading (some quicker than others).

So, if someone ever tells you that their “system” is better than yours, turn away and run and run fast because they don’t know what the hell they are talking about.

Here are some examples supporting this idea from the Market Wizard books:

  • Michael Marcus turned $30,000 into $80 million trading futures
  • Michael Steinhardt ran a fund that averaged 30% annual return over 21 years trading stocks
  • Tom Baldwin started with $25,000 and eventually traded $2 billion a day in T-bond futures on the floor or in the pit.
  • Paul Tudor Jones ran funds that averaged triple digit returns for five consecutive years trading multiple markets
  • Ed Seykota realized an astounding 250,000% return over 16 years (yes that says 250,000%) managing accounts trading in the futures markets – possibly the best trader of our time
  • Bill Lipschutz traded currencies with a staring account of $12,000 (started out as an architect – very motivating for me since I started the same way).

The list can go on forever but the point remains the same; they all traded different markets with unique systems from different locations (the floor, an office or their home in the mountains) but they all had one major factor in common: money management and risk management.

Just about every market wizard refers to position sizing as a major part of the “holy grail” of trading. Van Tharp (also featured in Market Wizards) coined the phase in the first edition of his book but he only realized that money management was the holy grail after studying and speaking with hundreds, if not thousands of very successful traders. Tharp’s Book, Trade Your Way to Financial Freedom, is a must read if you would like to understand position sizing and expectancy and learn more about understanding “you”.

The Holy Grail of Trading:
Understanding you and combining that with sound money management rules. Conquer these two entities and you will be successful beyond your wildest dreams!

Rochester Medical (ROCM)

Stock of the Day
Rochester Medical (ROCM)

Monday’s Closing Price: ROCM – $15.28

Sector: Health Care
Industry: Health Care Supplies
52-week Price: $6.85 – $29.76

The company develops, manufactures and markets a line of latex-free and PVC-free urinary continence and urine drainage care products. Eight of the past eleven quarters have reported higher earnings than the same period from the previous year.

The stock is not covered by many analysts and is thinly owned by institutional investors as you can see below. Add this to a small float and we have a stock that can pop at any time just as it did earlier this year. Based on the trade setup I presented yesterday, I have decided to develop two daily charts that explain the potential price targets in greater detail. The first chart shows a target zone based on the gap-down area from late April and early May. Can the stock trend higher and fill this gap? If so, we have a nice 50% gain on capital invested and a solid cash increase based on risk (potential 7R trade).

071007_rocm.png

The second chart overlays Fibonacci retracements and shows an identical target zone based on the 38.2% and 50% retracement levels. None of this is an exact science but it gives us an educated guess as to where the stock could move if it starts to trend or even pop. The stock is trading between the 50-d and 200-d moving averages and looks to be trading sideways in a suspicious manner. I have no idea what is going on after the huge run-up and breakdown earlier this year but I like the risk-to-reward setup. This is what I wrote yesterday when I first screened the stock:

Late Buy Opportunities:
“Rochester Medical (ROCM) has had one heck of a year as it blasted higher from $7.50 to as high as $29 in six months of time. Since the peak, the stock has corrected by 50% over the past two months and is now trading with a suspicious quietness above the 200-d moving average. Is there some type of news that will be released that will propel this stock higher? I don’t know but the trade setup is ideal so take it. Something may be going on behind the scenes so take the nice risk-to-reward setup.”

071007_rocm_fib.png

Institutional Analysis:
Held by Institutions: 21%
Money Market: 40
Mutual Fund: 15
Other: 1

New Positions: 27
Positions Sold: 2
Shares Held: 2.7 mil
Shares Held Previous Period: 2.1 mil

Shares Bought: 1.5 mil
Shares Sold: 0.9 mil
Value of Shares Bought: $22.7 mil
Value of Shares Sold: 14.1 mil

Top Institutional holders, Shares Held:
Oberweis Asset Management Inc., 413,650 shares
Dimensional Fund Advisors Inc., 281,774 shares
Allianz Global Investors of America L.P., 200,000 shares
The Vanguard Group, Inc., 166,467 shares
Bridgeway Capital Management, Inc., 152,800 shares

[Read more…]

Late Buy Opportunities

The four stocks highlighted today are all trading slightly above their 200-day moving average after making some type of a correction over the past couple of months. I call them late opportunities because they were correcting when the majority of the market leaders were making new highs. This type of action could allow us to label them as laggards but their overall weekly charts would suggest otherwise.

They have all managed to trade above their long term 200-d moving average while showing us a history of success. It may be my belief and your belief that the market is near a top but do we really know when the market will officially top and start to trend lower.

I don’t think so!

So, take the trades since they have ideal risk-to-reward setups. What is the worst that can happen? You sell for a small loss. Big deal because this has been one profitable year so take the trade! These stocks aren’t the market leaders but you may be able to squeeze some profits out of the current moving average setups. We’ll call them lazy summer buys.

AllianceBernstein (AB) was one of the more consistent performing stocks on the MSW Index prior to me shutting down the index in March. The stock was screened heavily last summer and I started coverage on the 29th of July, 2006 at $66.90. The stock gained as much as 40% while on the index but has recently traded slightly downward as it makes a correction towards the 200-d m.a. It tested the line last summer and that is when I saw an ideal buying opportunity so I am now looking for a similar situation. It held the long term moving average as support last week so I would not have a problem taking a position.

(AB) Potential Trade Set-up:
Ideal Entry: $84 to $86 (currently $90.14)
Risk is set at 1.0% maximum of total portfolio or $1,000 of $100k
Stop Loss is 9% or $82.03
Number of Shares: 123
Position Size is $11,112
Risk is $8.11
Target is $108
Risk-to-Reward is 2-to-1

***The ideal entry would be near $84 for a risk to reward of 7-to-1. The stop loss would be 3% or $81.48 with a stop of $2.52.

070907_ab_wkly.png

Rochester Medical (ROCM) has had one heck of a year as it blasted higher from $7.50 to as high as $29 in six months of time. Since the peak, the stock has corrected by 50% over the past two months and is now trading with a suspicious quietness above the 200-d moving average. Is there some type of news that will be released that will propel this stock higher? I don’t know but the trade setup is ideal so take it. Something may be going on behind the scenes so take the nice risk-to-reward setup.

(ROCM) Potential Trade Set-up:
Ideal Entry: $15 (currently $15.14)
Risk is set at 1.0% maximum of total portfolio or $1,000 of $100k
Stop Loss is 5% or $14.25
Number of Shares: 1,333
Position Size is $20,000
Risk is $0.75
Target is $21
Risk-to-Reward is 8-to-1

070907_rocm_wkly.png

Click through to see the ideal trade setups for CHINA and GMKT:
[Read more…]