The five charts tonight profile what a stock looks like as it starts to breakdown and become a prime shorting candidate. I have been highlighting multiple shorting candidates (stocks trending downward) over the past several nights with the exact characteristics of the charts below.
Recent stocks trending down:
- Daily Screen for Monday 3-10-08
- 10-Week Crossing Below 30-Week Moving Average
- Hurting Stocks to Short?
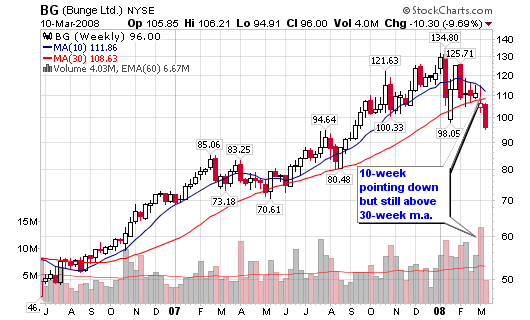
Stage I
Bunge – 96.00, is a stock that is starting to breakdown after a prolonged period of up-trending price increases. The stock continuously maintained a position above the 30-week moving average after the 10-week moving average crossed above it in the summer of 2006. However, recent action suggests the stock is going to fall as the 10-week moving average is now pointing down on above average volume. A cross of the 10-week moving average below the 30-week moving average is a major red flag and sell signal. The first failed attempt to recover the 30-week moving average is the ideal shorting signal.
Stage II
SYK – 59.74, here is a stock that also enjoyed a prolonged period of up-trending prices from the summer of 2006 until the close of 2007. The stock started to drop hard on above average volume in January of this year and now shows signs of a prime shorting candidate. The 10-week m.a. is now below the 30-week moving average with both lines starting to point south. The next failed attempt to recover either moving average is a short setup. Rallies will occur and this is where opportunity will lie.

Stage III
MS – 38.30, Morgan Stanley is a stock that has been hit hard since the collapse of the credit markets and the sub-prime fallout. The 10-week moving average gave us the exact moment to classify this stock as a red flag back in July of 2007. From there, the stock failed to recover the 30-week moving average and presented a prime shorting opportunity. Only the best traders took this trade as the overall market was still trending higher. The extreme volume confirmed the downward spiral that would follow and the stock has yet to recover the 10-week moving average. Day traders will continue to short every failed rally attempt back to the 10-week or 50-day moving average

BSC – 62.30, Bear Stearns is in the same boat as MS as it is now down more than 60% since it’s high of $170 last January. The 10-week violation of the 30-week line was the first signal back in April 2007. The failed recoveries in the summer of 2007 confirmed this stock was going lower. Again, only the best traders in the world took this trade from a longer term perspective (I was not one of them). Cramer was SCREAMING buy for BSC all summer long – but we already know he is no longer a trader, just a TV personality and that says it all. The failed rally in September and October was an ideal shorting opportunity for second chance(ers). The weakness was obvious at this point but the risk/ reward was still excellent.
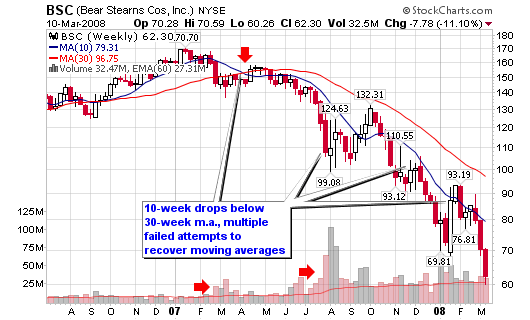
Both MS and BSC show us what can happen to the stocks we have been screening in Stage I over the past several nights.
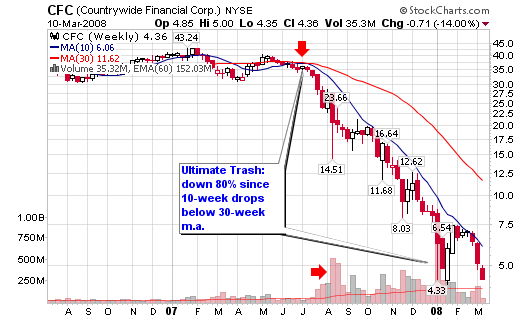
Stage IV
This stage gives us the trash of the market, the worst of the worst! Our representative tonight is Countrywide Financial (CFC – 4.36) as the stock’s 10-week moving average crossed below the 30-week moving average in June 2007. From there, the stock has given traders at least a half-a-dozen shorting opportunities for the intermediate to longer term trader. Stage IV stocks will take a couple courses of action: continue to drop to worthless status or trade along the muck of the market for years to come. Yes, some will recover but I wouldn’t advise bottom-feeding and wasting you hard earned capital with these proven losers.
There you have it, the four stages of a prime shorting candidate from a longer term trader’s perspective.


I see that AMZN has the 10-week MA cross the 30-week and the slope of both is down and the price below them as well. Of the 4 horsemen, AMZN is still aloft. Time to short?
I own a stock that probably fits this category….SIGM. Problem is I really like the company and the fundamentals but the stock has been killed since January. Any thoughts on this one? they have earnings tomorrow.
Arekay,
Yes, AMZN is another stock that qualifies under the rules I have been using with shorts (10-week and 30-week moving average.
Eric, you may trade for the long term but I don’t understand why you held after the 200-d m.a. was violated. I can see holding from highs, back down to the 200-d but that is my mercy point when I am long. I liquidate after a break below this line, regardless of what the fundamentals say.
The next support area is above $19.75, after that, the bottom could drop all the way down to the single digits (with some support of the $15 area).
Thanks Chris. Just a big mistake on part for holding as long as I did. One of those situations where I kept waiting for the bounce that never came. I guess this will be the stock I learn from. I took my losses yesterday and have moved on and will try to never make the same mistake again.
Great site!