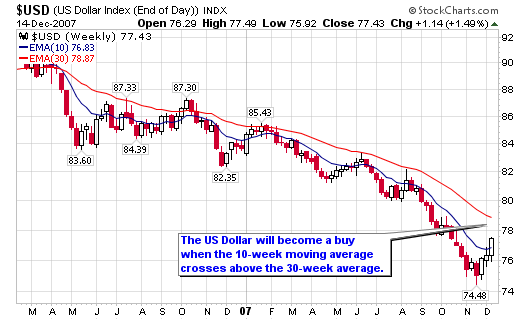
Well, I am fresh off of my Europe trip and ready to study the charts this week. I’ll start by posting a few charts of the US dollar. I have talked about these buy and sell signals in the past and wasn’t surprised to see this pattern upon my return. I was witness to the USD gaining some strength over the past few weeks while traveling. The large chart shows that this is the first true buy signal in more than 3 years (2005).


UPDATE: You can trade the USD like a stock by buying the long or short ETF:
Long: PowerShares DB U.S. Dollar Bullish (UUP)
Short: PowerShares U.S. Dollar Bearish (UDN)
I will cover these in an additional post later this week.
The metals have been weak; especially Platinum and Gold (see this February post, 02/18/08: Platinum Climax Top?, where I highlighted the climax top in Platinum). I’ll admit: these things take time but typically work out if you stay with the signs and have the patience to pounce when the move begins. The signs started in February but didn’t give the signal until July.


Connect with Me