Top Rated Stocks

Today I am posting a list that shows the stocks that are making multiple screens based on my fundamental screens and scans (click the link to understand the criteria in more detail). I run these scans every night and make notes of stocks that are appearing on more than one screen (I have found that these are the strongest stocks in the market and have been using this method for almost eight years).

I do own several of the stocks listed below but I am always ready to jump into new opportunities when the risk/reward warrants the purchase. I keep my personal watch list up to date on a daily and weekly basis so I can make a move when the charts are screaming buy. I also watch my current holdings to look for red flags that help me determine if a stock needs to be sold (yes, I do have predetermined sell points once I reach a 25%+ profit but I do remain active when monitoring my portfolio).

Two of the most important screens that have helped me buy and sell since 2007 have been stocks with:

  • Institutional Sponsorship Increasing
  • Quality Stocks with a new IPO within the past two Years

Stocks making new highs and stocks within 15% of new highs haven’t been my bread-and-butter in 2008 nor have stocks trading along the 200-d moving average. I have explained in the past how I use my screens and scans and how I determine which ones are more relevant during specific markets environments.

Top Rated Stocks according to my Research
*Disclaimer - this is not a buy list!*

  • SOL – 25.08, ReneSola Ltd. , the young stock has moved from $7.36 to a peak of $29.48 in two months with solid institutional accumulation along the way. Any drop with support in the $20 area is an excellent risk/ reward buy.
  • POT – 199.07, Potash Corp. Saskatch Inc., is the superstar of all superstar stocks over the past two years. Shorter term plays can happen on pullbacks to the 50-d m.a.; longer term accumulation can take place at the 30-week moving average. I wrote about the sister stock IPI in April.
  • MA – 308.65, Mastercard made another new all-time high this week as it reached $320 with consumers using the plastic as their home equity loans dry up. I still own the stocks and will continue to hold untila trend snaps.
  • SD – 55.00, Sandridge Energy Inc., made another new all-time high this week and it continues to trend higher on increasing volume. A couple late day reversals to end the week sent up a red flag (minor at this point in time).
  • GTLS – 41.89, Chart Industries Inc. is trading near new all-time high territory as the trend is higher. A move above $43 will trigger a triple top breakout on the point and figure chart (a positive sign if it comes on heavy volume and without a reversal).
  • TITN – 24.30, Titan Machinery Inc. is still making new all-time highs but did run into some selling pressure near the $26 level. The trend is higher and I am holding until told otherwise by the charts.
  • GFA – 44.68, Gafisa has been an enigma in my mind as I figured it would be much higher by now based on fundamental and technical feedback. But, we all know that’s not how the market works – it’s not rational in the way we think it should be. In any event, GFA remains a top rated stock on multiple screens I run every night.
  • V – 86.36, Visa is closing in on a new all-time high after the recent dip from last week which did present an excellent buying opportunity or additional accumulation area. I am a holder and will look to add on opportunities such as last week as Visa remains the new MA in my portfolio eyes. Again, the market must tell me otherwise before I consider selling.
  • HES – 122.81, Hess Corp. has been on a tear but is now extended from the major moving averages. Ideal accumulation areas along the present themselves on pullbacks to the 50-d m.a. and/ or 200-d m.a.
  • LL – 15.88, Lumber Liquidators, the recent up-trending chart is nice to look at but I am skeptical about its market. It sells hardwood flooring and we all know the construction industry is taking a black eye in the media and sheep follow the media (their decisions are based on what they see and hear). Regardless, the stock showed up on multiple screens once again so I can’t ignore it because of my biases.

Other High Rated Stocks in my System:

Young Stocks Moving on Volume

A screen I run often searches for stocks that have debuted on the market with an IPO within the past two years. I prefer trading in young innovative stocks that can make strong moves based on powerful earnings and revenue increases.

Today’s group contains stocks that are very familiar to this blog as they continue to appear on almost every type of screen I run.

Why?

They have been the leaders of the market over the past 1-2 years at one point or another. I can’t say that I would buy shares in all of the issues listed below but they are on a watch list. Momentum trading has been very profitable over the past 6-8 weeks as we can see in stocks such as CLR and SD.

Continental Resources is up more than 100% since it’s low in January of this year. It’s moved from $24.44 to $47 in one month on huge volume versus the average. The stock is certainly extended but that’s what I thought when it debuted on the blog on January 7, 2008 at $26.57

CLR – Continental Resources Inc., $26.57
This is the first appearance of the stock on this blog as it has had a nice run from $15 to $28 in four months. The stock is extended but trending higher. An ideal entry is above the 50-d m.a. Set up a favorable risk-to-reward trade before entering.

Titan Machinery and Visa Inc reported solid numbers but their stocks went in opposite directions based on the guidance they gave moving forward.

Young Stocks up on Higher Volume
Read more »

Stocks Building Bases

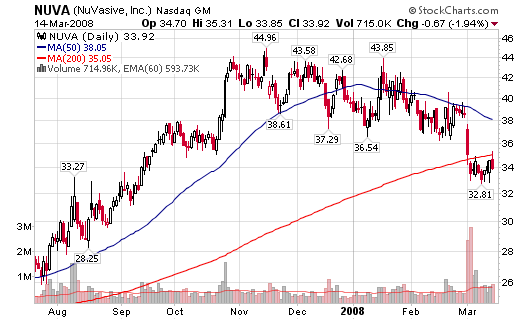
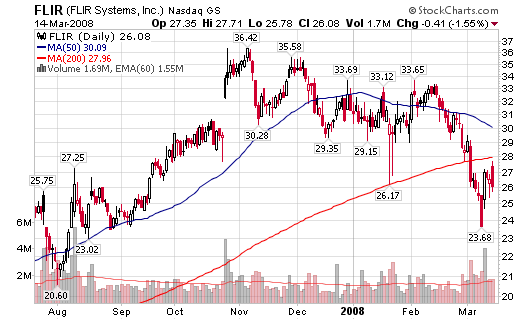
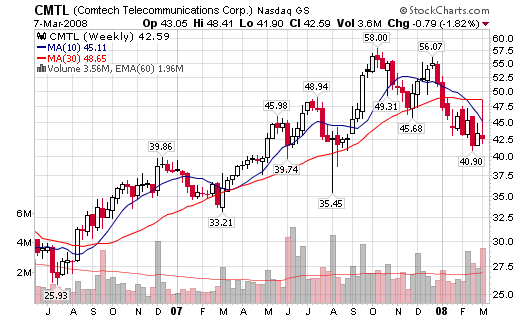
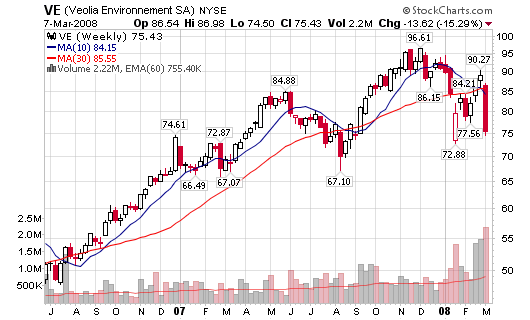
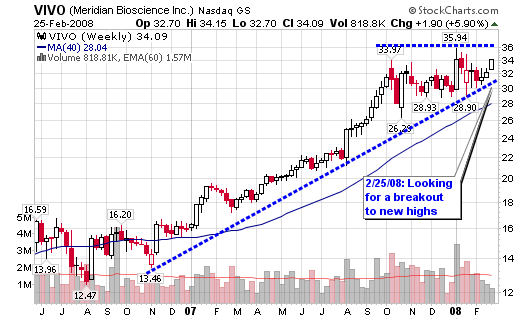
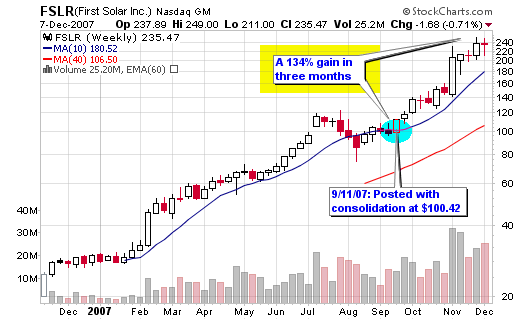
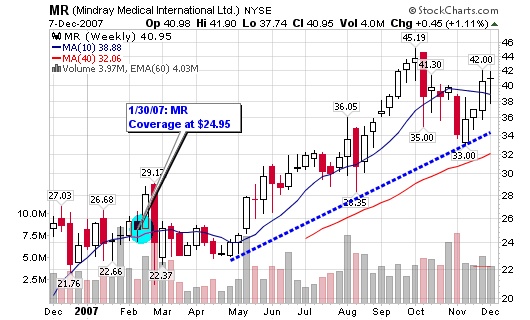
We start the week by studying stocks that are currently building bases. I decided to specifically narrow the list down to stocks that are building cup shaped bases. Each stock presented today contains respectable fundamental characteristics such as strong earnings and revenue. Many, if not all of the stocks below have been covered within the past 6-12 months on the blog. A few of the stocks listed are building their first major bases since their spectacular up-trends in 2007.

Each stock has gained support along the 200-d (40-week) moving average while building their current base. The market has been moving higher but many pundits are calling this positive move a “head-fake” or slight pause in the main trend which is down (in their opinion). I couldn’t tell you if they are correct but buying stocks while they make new highs during a suspect market can be costly if it reverses. I prefer to buy stocks making new highs during an obvious up-trend. In any event, let’s go over a few technical rules for stocks building cup or saucer shaped bases.

On the weekly charts:

  • Look for more up-weeks than down-weeks while the stock is building the base.
  • Make sure that the volume is higher during the up-weeks than the down weeks.
  • Volume should be below average or lighter during the down-weeks than they are during up-weeks.
  • Stocks tend to make 3-5 bases during a long run over a few years. Be careful with stocks making late stage bases (4th base or later); they are more vulnerable to failure as most of the “smart money” (institutions) have rotated their cash into new stocks.
  • Sell if a stock breaks out from a base on above average volume but suddenly reverses below the pivot point (ideal entry) that same day or a few days later.
  • Beware of stocks trying to make news highs on above average volume but fail to end the day in the upper half of its daily range. This may be a reversal and a possible red flag.

Read an article I posted last January on How to Calculate a Stock’s Pivot Point:

How to Look for a Cup with Handle (chart #1):

Look for relatively quiet volume as the stock builds the left side of the cup. Volume at the base of the cup should be slightly higher than the left side as support is coming into the stock. The right side of the base should have above average volume with more up-days than down days. The handle will be the last part of the formation and should slope slightly downward with lower volume than the right side of the base. The pivot point will be slightly higher than the highest point of the right side of the base. All breakouts should occur on volume 100% greater than average daily volume although IBD does say that breakouts above 50% do qualify.

How to Look for a Saucer with Handle (chart #2):

Look for relatively quiet volume as the stock builds the left side of the saucer. A saucer looks similar to the cup-with-handle but the dip from the high to the low is smaller and usually longer in duration. Volume at the base of the saucer should be slightly higher than the left side as support is coming into the stock. At this point, the base may almost qualify as a flat base. The right side of the base should have above average volume with more up-days than down days but this does not have to be as prominent as the cup-with-handle. The handle will be the last part of the formation and should slope slightly downward with lower volume than the right side of the base. The pivot point will be slightly higher than the highest point of the right side of the base. All breakouts should occur on volume 100% greater than average daily volume.

All stocks and charts are listed in alphabetical order:

Read more »

Challenging the 200-d m.a.

Today’s screen is covering stocks that are trading below the 200-d m.a. and are currently attempting to challenge the line for the first time since their fall from 52-week highs. The first failed attempt to recover the 200-d m.a. is typically an opportunity to short or a signal to buy put options.

However, historical charts show that the likelihood of an ideal short setup comes when the 50-d m.a. is trading below the 200-d m.a. By the time the 50-d m.a. crosses below the 200-d m.a., a second challenge is taking place and this is where I look to initiate a position. I will be watching these stocks for that type of opportunity.

031608_nuva_daily.png

031608_flir_daily.png

  • NUVA – 33.92, screened a couple weeks back as the stock is now trading below the 200-d m.a. The stock is now trending back towards the 200-d m.a., also known as the next ideal short setup.
  • FLIR - 26.36, NuVasive reversed on Friday after a failed attempt to recover the 200-d m.a. The 50-d m.a. is still above the 200-d so this will keep me on the sidelines. However, the failed recovery and a crossover in the future will catch my attention for a trade setup
  • DECK - 105.23, the stock has moved from $89.88 to $102 over the past few days as it looks to challenge the 200-d m.a. for the first time. A failed attempt to recover this line will be the first short setup/ opportunity. I would like to see the 50-d m.a. fall below the 200-d m.a. before initiating a position.
  • CRL - 56.02, Charles River is in the same boat as FLIR and DECK as the 50-d m.a. is still trading above the 200-d m.a. The stock reversed on Friday as it attempted to recover the line.
  • OII – 61.30, the stock was up almost 3% on Friday on strong volume but the 50-d m.a. recently crossed below the 200-d m.a. The downturn of the 200-d m.a. is still premature but the overall trend seems ot be turning downward.
  • STRA – 156.00, the strong education stock is starting to hit hard times as the 50-dm.a. is trending downward towards the 200-d m.a. The price is currently challenging the 200-d m.a. for the first time in years.

Read more »

Daily Screen for Monday 3-10-08

The market and individual stocks in general continue to get pounded so my screens will continue to provide us with short candidates or stocks trending lower. Today’s screen gives us five stocks that show the 10-week moving already below the 30-week moving average and two stocks headed in that direction.

Recent stocks trending down:

030908_cmtl_wkly.png

030908_ve_wkly.png

10-week average below the 30-week average:

  • CMTL – 42.59, the stock dropped $4.66 on Friday on volume 147% larger than the average. We also witnessed a large reversal at the 30-week moving average as the 10-week moving average continues to move lower.
  • VE – 75.43, the stock was down 15.29% last week with volume 350% larger than the 50-d m.a. on Friday (it was the largest weekly volume in years).
  • MR – 30.99, one of the top performing stocks on this blog in 2007; but it is now facing some trouble as the 10-week m.a. is below the 30-week moving average. Volume is starting to increase during distribution weeks.
  • MORN – 60.95, the stock failed to complete the $60-$100 run as the 10-week m.a. is now below the 30-week moving average. Volume is increasing with multiple distribution weeks over the past four months.
  • SI – 123.53, Siemens is falling on above average volume with a recent reversal at the moving averages. Both the 10-week and 30-week moving averages are trending downward.

Read more »

« Previous PageNext Page »