How to Make Money Selling Short

The title of the post is borrowed from the book “How to make Money Selling Stocks Short” by William J. O’Neil. It’s an ideal book for investors that focus on trading longer term trends and don’t necessarily do this for a profession (i.e.: day traders).

The book contains some excellent strategies for finding prime shorting candidates or stocks that are about to enter a declining stage that may offer excellent risk/reward setups for buying put options.

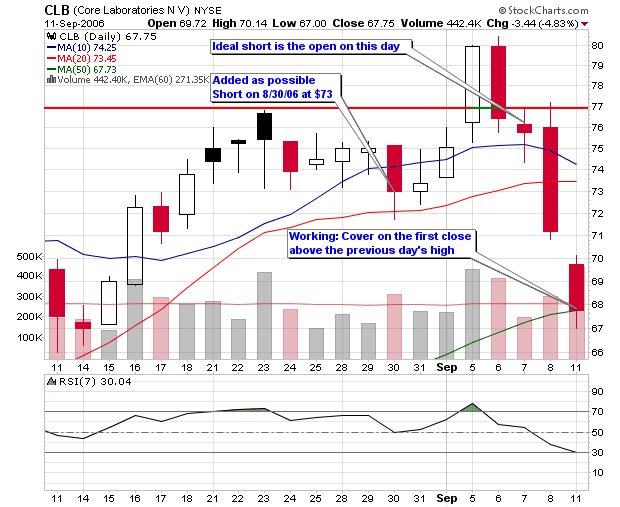
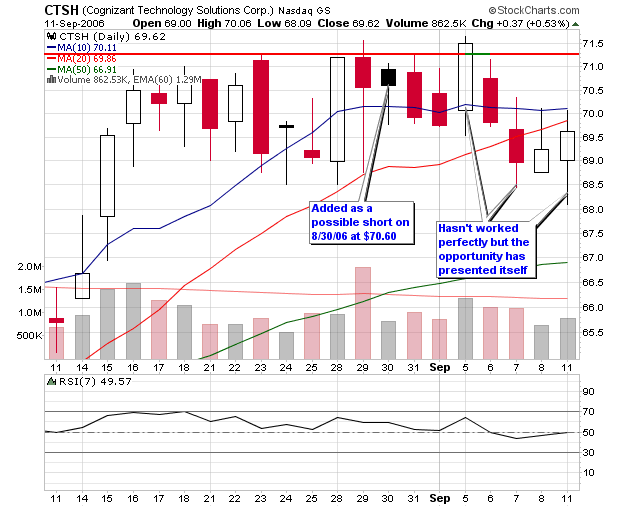
(CLICK FOR LARGER IMAGES)
101507_csco_short_sm.png

I consider several of the techniques in the book to be a reverse of the popular trading system? Study the charts from the past that have setup ideal shorts and then screen for those same characteristics in stocks trading today. Many of the ideal shorts from past market declines have held the reverse characteristics of an ideal “popular system” stock (that you would want to buy).

Many traders believe that the most obvious area to place a short would be near the peak of stock’s trading range but studies have found this to be untrue.

101507_jdsu_short_sm.png

Characteristics of Longer Term Trend Shorts

  • Most ideal longer term “trend” shorts take four to twelve months after the peak price to setup on the weekly chart with the majority of these shorts triggering between six to nine months.
  • Look for stocks that had prior up-trends and support levels that can now act as downward resistance or entry areas.
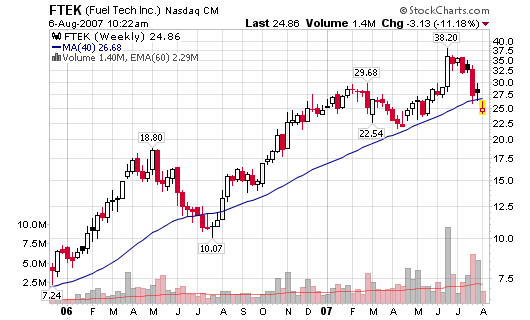
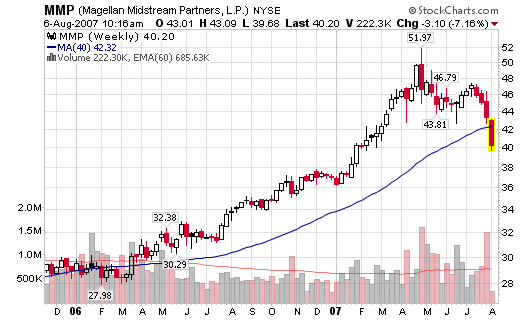
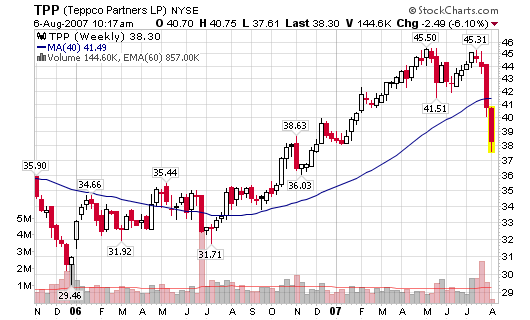
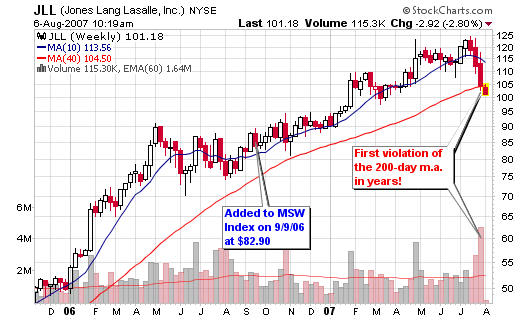
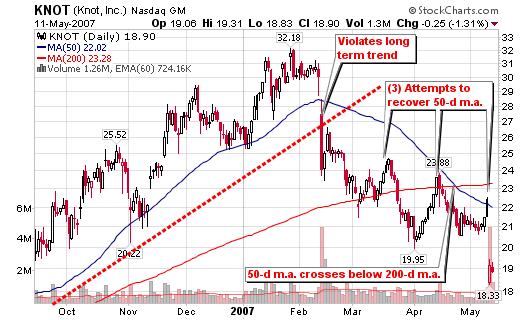
  • Once a stock tops and starts to consolidate, you want it to slice through the 50-d moving average and then the 200-d moving average.
  • A crossover between the 50-d m.a. and the 200-d m.a. is ideal and is graphically presented on each chart in this post
  • The odds of success increase with each failed attempt for the stock price to recover these major long term moving averages.
  • Head and shoulder tops can also serve as ideal setups for potential shorts if they take at least five months to develop.
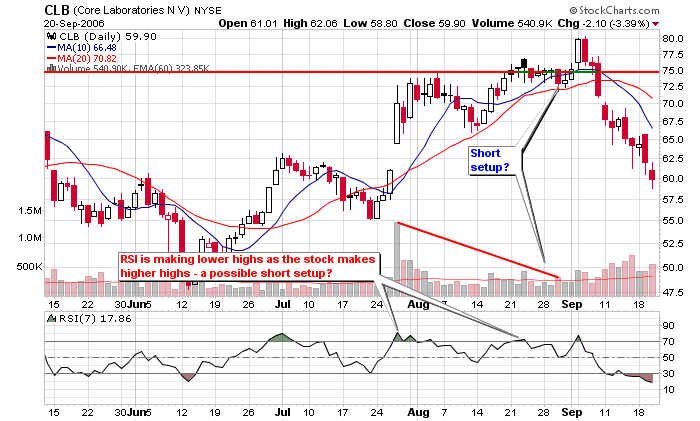
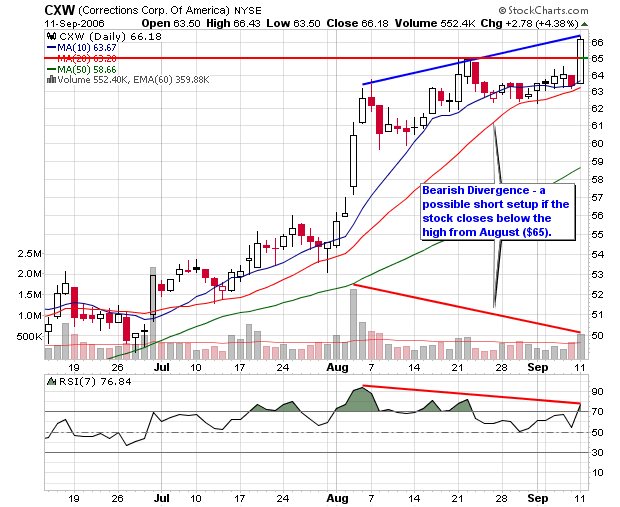
  • A decreasing relative strength line and a negative pattern on the point and figure chart can also confirm that the stock is rolling over and setting up an ideal short.
  • Finally, volume should be increasing and the stock should be under distribution as it violates the major moving averages and starts to break former support levels.

[Read more…]

Troubled Stocks?

Are these stocks headed for more trouble? If so, are they setting up ideal short opportunities? Are they past their ideal shorting opportunity? Take a look for yourself.

080607_ftek_wkly.png

I was running a basic screen this morning looking for stocks above $15 per share that were violating their 200-day moving average on above average volume. The daily volume must be at least 50% larger than the average over the past 50 days. The current price must be within 5% above the 200-day moving average or 15% below the 200-day moving average.

080607_mmp_wkly.png

Top Ten Price Declines (Monday morning trading):

  • (NVR) N V R Inc
  • (MMP) Magellan Midstream Ptnrs
  • (WPZ) Williams Partners Lp
  • (FTEK) Fuel Tech Inc
  • (PAA) Plains All Amer Pipe
  • (TPP) Teppco Partners Lp
  • (BPT) B P Prudhoe Bay Rylty Tr
  • (JLL) Jones Lang Lasalle Inc
  • (KMP) Kinder Morgan Energy Lp
  • (GSF) Globalsantafe Corp

080607_tpp_wkly.png

Top Ten Decliners on Largest Volume (Monday morning trading):

  • (FTEK) Fuel Tech Inc
  • (NRGY) Inergy L P
  • (MMP) Magellan Midstream Ptnrs
  • (IJJ) Ishares S&P Mdcp 400 Vl
  • (BTE) Baytex Energy Trust
  • (BPL) Buckeye Partners L P
  • (XOP) Spdr S&P O&G Expl
  • (EPD) Enterprise Products Ptnr
  • (TPP) Teppco Partners Lp
  • (PGH) Pengrowth Energy Tr Unit

The most interesting stock on the list for me is JLL as it has been a market leader for years. The beginning of the end of all great bull runs can be pinpointed to the collapse of many of the great leaders during that period. I have watching many of the top stock leaders of the past year starting to reverse their fortunes and correct back down towards their 200-day moving averages and in some cases, violate the line for the first time several years. Is this a correction or the end? I don’t know but I’ll trade the setups!

080607_jll_wkly.png

Interesting times!

How to Short a Stock

To short means that you borrow stock from your broker to sell to a third party. The idea is to buy back the stock at a lower price, returning the shares to your broker while leaving the remaining cash in your account as a profit. A short seller does not own the stock before they sell it as they borrow it from another investor who already owns it. At a later date, the short seller buys back the stock they shorted and returns the stock to close out the loan. If the stock has fallen in price since they sold short, they can buy the stock back for less than they received for selling it. The difference is your profit. Please note that short selling is a transaction made on margin.

To initiate a short sale, you must place the order with your broker or online brokerage by determining the size and price at which the trade will occur. Your broker or brokerage company will check to see if shares are available in the specific stock selected or if they can borrow the shares. Once they are available or can be borrowed, they will be sold in the open market on the first plus tick or continuation of an up-tick also known as zero-plus tick (the stock must move up for the transaction to complete). To close the short position, the broker will purchase the shares using the original proceeds and return the shares to the third party.

051407_knot_daily.png

As a short seller, you believe that the price of a particular stock will fall in value over time. For example: by establishing a short position for 100 shares in XYZ at $50, the broker will place $5,000 into your margin account. If the stock falls over the next few weeks and you decide to cover the short at $40, you will initiate a buy for 100 shares in XYZ using the money placed in your account when you sold short. The cost to buy back the shares in this example will be $4,000 or $1,000 less than the original short sale amount. This difference in price will result in $1000 cash that will now become your profit.

On the flip side, if the stock was to jump to $60, you would most likely cover your short or have your stop loss triggered, buying back the shares at this price. The cost would be $6000 or $1000 more than the original short sale, resulting in a 20% loss. The broker would take the additional $1000 from your cash account to cover the loss in the short sale. This is how you can lose money when shorting stocks. The higher the stocks rises, the more money you can lose, theoretically resulting with an infinite loss (excluding stop losses and broker margin calls).

If the stock rises in price or if the value of the stocks you are using as collateral goes down in price, you may be forced to add cash to your margin account or cover the short sale prematurely. Keep in mind that you must pay any dividends issued while you are short a particular stock.

[Read more…]

CLB was my Home Run

On August 30, 2006, I posted up a few short opportunities based on a strategy I have started to study and use. Similar to baseball, low averages can still make you a lot of money. What do I mean?

A player that hits .300 for a career or records an out 70% of the time has a good chance to make the hall of fame. The same holds true for stocks because a couple home runs here or there can make your entire year.

Core Laboratories will not make my year but it is one short that has made quite the impression my new technique. The stock is now down over 20% since I caught the short setup in late August. Yes, I am gloating but it’s because I am excited to see a home run so early while trading these new setups (new for me at least).

A CANSLIM investor may toss aside a 20% gain as average but this is not a CANSLIM tactic, it’s a short term strategy that is supposed to be closed within days and sometimes hours. CLB is still an open winning trade from a couple weeks ago as the stock has traded down 9 of the past 11 days but has never closed higher than the previous day’s high.

Volume has been larger on down days and the RSI has completely broken down. John Carter recommends that a trader should start watching intraday charts as the trade becomes extended so you can close out with a solid profit. However you setup your stop; DO NOT let the profit erode as that could be devastating to your emotional balance. Of the four stocks selected in late August, one worked in the short term, one failed miserably, one broke even and one was a home run. The losers or break-even stocks were cut short with minimal losses so they don’t matter to the overall portfolio. You can win 30% of the time in the market and still be very profitable! Here I recorded a 25% win ratio but the winner was big so it eclipsed the other trades and puts me in the green!

The original post can be found though this link:
Possible Short Setups

One last thing: you will notice that the gap-up from late July has been filled and it has taken two months.

Piranha

A New Short Candidate & Updates

I wrote a post prior to the market open on August 31, 2006 and uploaded four charts of stocks that may be showing a possible short based on a simple bearish divergence technique I have been studying. Three of the four stocks have showed profits with CLB breaking down with the largest profit opportunity.

Based on that blog entry, I have decided to update what has happened over the past couple of weeks and present a new opportunity from my research tonight.

Corrections Corp. of America:
CXW – 66.18,
a 4.38% gain on volume only 36% larger than the average. I see a huge bearish divergence on the charts with a short setup. The entry is the day after the stock closes below the previous high which is $65.

As you can see, each stock did make a gain on the short side but the charts show why a couple of them didn’t set up properly. I would also suggest to use an intraday chart to close the position rather than a daily chart. Please see the original post to understand what I was looking for: Possible Short Setups

The stocks listed on 8/30/06:
PSPT – 16.92 (low 15.45 9/7/06) – 8.69%
CLB – 73.00 (low 67.00 9/11/06) – 8.22%
CTSH – 70.60 (low 68.09 9/11/06) – 3.56%
BMC – 26.97 (low 26.16 9/7/06) – 3.00%

I am new to short term trading (long time CANSLIM trend trader/swing trader) and will continue to use the blog to post up what I am looking at with equities.

Piranha