Top 10 Stocks to Watch: Trend Buys

The stocks listed today are some of the top candidates on my buy list for trend opportunities over the next several months. Each of these stocks has been screened numerous times on the MSW Index in 2007 and will be featured on the NEW MarketStockWatch.com that will be released in late April.

I am changing the MSW format to a service that generates revenues strictly from advertising rather than subscriptions. I am excited to release my research such as daily screens, weekly screens, the MSW Index and the MSW Portfolio to everyone for free. I will have the new site up and running when I return from my trip to Hawaii in April. I am looking forward to the trip to clear my head from the recent events in my life and to start a new venture for my equity research company.

I would like to thank the 700+ members that signed up for at least a trial subscription to MSW over the past two years; it was a great ride and I enjoyed every minute of it! Don’t worry, the new version of MSW will be even better as I will move to a blog format so I can incorporate images easier and post on a more frequent basis with total control of the site.

032307_edu_daily.png

Now, here are the top 10 stocks I am watching for my own Portfolio (in no special order):

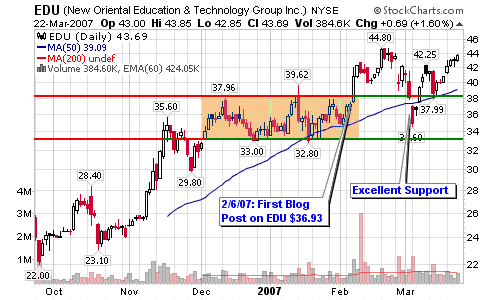
  • EDU – 43.69, the stock has been acting excellent over the past several weeks during the market drop as it actually offered a key entry above $34 to start the month. The MSW Index stop loss area was $30 so EDU is very much a candidate. The ideal entry is near the 50-d m.a.
  • CBEY – 29.03, the stock has been consolidating over the past four months without violating the 200-d m.a. so that is positive but recent volume has been increasing on distribution days. It is a buy if it holds support above the 200-d m.a.
  • FTI – 69.26, the stock came to the MSW Index as a possible $60-$100 candidate and has held up very well in March with an 8% gain and a 17% gain in 2007. Ideal trend buys above the moving averages or the $64 support area.
  • ICON – 21.22, the stock hasn’t moved much over the past couple of months but the consolidation is welcomed after the large two year run from $4 to $23 (475% gain). My ideal area to grab shares is along the 200-d m.a. and I will wait for this potential opportunity (I will not chase).
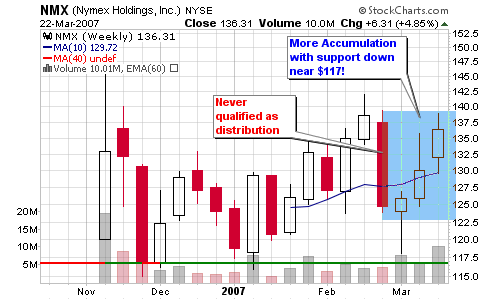
  • NMX – 136.31, I purchased the stock in January at $119 but I sold after the large declines in exchange stocks for a small profit earlier this month. That’s too bad because it is now back above $136 and showing solid action on the weekly chart. I am looking to reestablishes shares with $130 as the current pullback target.
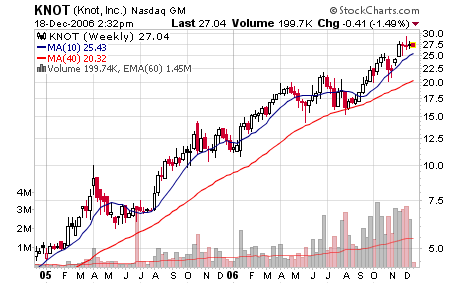
  • KNOT – 23.54, a very interesting stock that is currently catching support along the 200-d m.a. for the third time in two years. The huge distribution from February concerns me so I will need to see some up-ticks accompanied by strong volume before I enter.
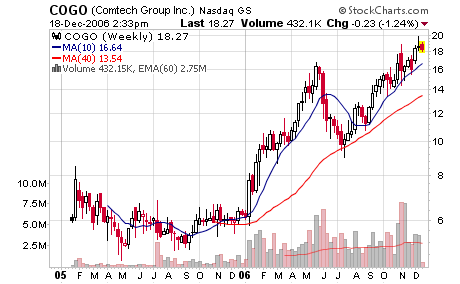
  • COGO – 17.80, the stock recently offered an entry along the 200-d m.a. but I couldn’t take advantage of the trade setup due to personal circumstances (my father’s death). I am not one to trade during extreme emotional events. Anyway, I am looking for a new setup to form before grabbing shares as I won’t chase a poor risk-to-reward setup. The triple top breakout was above $17 on the point and figure chart
  • ZUMZ – 41.83, the stock is now acting well after being placed onto the MSW Index at $35.81 with an original buy at $32 and a target of $40 (this was accomplished). The stock started to make my screens just when WallStrip was making a video on the company. Weekly accumulation versus distribution looks solid. We now need a new setup to form in order to grab shares or add to an existing position.
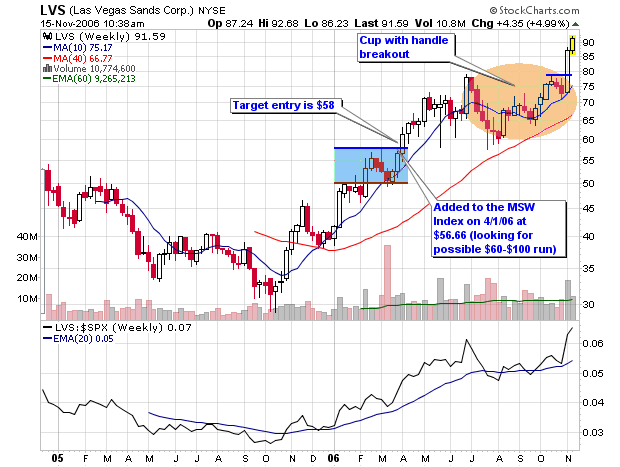
  • LVS – 91.25, the stock was a superstar in my own personal portfolio last year and has since been sold but I am now interested in a new position as it looks to be holding support above the long term 200-d moving average. I would like to see stronger volume during up-weeks before taking this venture once again.
  • HWCC – 25.34, a new candidate to the MSW Index in March as the stock shows excellent “young growth stock” characteristics and a chart pattern that is trending higher with an ideal entry above the 50-d m.a. or near support at $23.

032307_nmx_wkly.png

To see all of these charts and much more (90 charts in all), visit my personal chart’s page over at StockCharts.com. I do need to update my annotations but give me some time because I am just getting back into the research this week.

Enjoy the Weekend!

Moving Average Trend Buys

The stocks listed below are all trading within 10% of the 200-day moving average and have been leaders over the past year. Fundamentals are better than the majority of the peers in their industry groups and the technicals show potential opportunities. Many of the possible opportunities will struggle if the market takes a turn for the worse so please understand the “general market trend”.

They are not recommened buys so please do you own due diligence!
This screen is performed nightly looking for stocks that are trading higher within the set parameters. These include fundamentally sound stocks with increasing earnings, a gain during the day today and preferably a move on above average volume.

A Few Interesting Stocks within 10% of the 200-d m.a.:

  • BIDU – 100.97, the recent $60-$100 candidate has corrected from highs near $134 to catch some support at the long term moving average. The point and figure chart suggests positive action if the stock holds support

    032107_bidu1.png

  • SHLD – 179.16, the stock is consolidating once again but my ideal entry would be closer to the 200-d m.a. near $165.

    032107_shld.png

  • DLLR – 25.39, the first correction to the 200-d m.a. since 2006. It will become an ideal trend buying opportunity if the support is held. Look for the RS line to reverse back to the up-side

    032107_dllr1.png

  • ANDE – 42.54, the stock is trading flat to slightly higher over the past few months. Any rebound could take the stock back towards $60 (a nice risk-to-reward ratio)

    032107_ande1.png

  • CSH – 42.50, the recent superstar stock is finally touching the 200-d m.a. for the first time since 2005. Any support in this area is a solid trend buy

    032107_csh1.png

  • HITT – 41.07, the stock is forming a basing pattern above the 200-d m.a. which shows some strength. The point and figure chart shows a negative trend forming but a move above $45 will reverse that outlook

    032107_hitt1.png

  • CRVL – 31.85, the stock made a tremendous run from $11 to $49 but has recently corrected to the 200-d m.a. near $30. I am not sure if this is a dead cat bounce but support in this area will signal a potential basing pattern and possible opportunity

    032107_crvl1.png

  • EZPW – 15.54, the stock has caught some support three times over the past two months at the 200-d m.a. but volume has been weak. Possibly a cup or saucer shaped pattern above the long term average

    032107_ezpw1.png

Stock Predictions for 2007 – Oh NO!

Ticker Sense, the blog run by Birinyi Associates, conducted a year end survey that looks towards the future. It’s titled the “Financial Blogger Outlook” and included 29 of the web’s most prominent financial bloggers (in their opinion of course). They asked a number of questions about the closing prices of the major indexes, the best and worst performing sectors, the top stock picks for 2007 and more.

I was reluctant to participate because predictions don’t mean a damn thing in this business but I did it for fun. I was probably the last blogger to submit my survey and I belive that I actually missed the deadline because I was going to skip the “prediction business”. However, I’ll look back on what I wrote at this time next year and will assure you that my predictions won’t guide my trading one bit.

So, what was my forecast?
Why use the word forecast? Because this word is always associated with the weather and weathermen are typically wrong. Stocks predictors can be lumped into the same stereotype because they are usually wrong too.

I predicted that the major indexes would be slightly lower at the end of 2007.
I predicted that energy and financials would be the top performing sectors.
I predicted that consumer related sectors would perform the worst.
I predicted that growth stocks would outperform value stocks.

I made several selections from the survey that matched one stock’s performance versus another stock’s performance. For example, APPL and MSFT were included in this section. You’ll have to wait until TickerSense publishes these results to see how I selected.

Finally, they asked for five stocks that I felt would outperform their peers in 2007. Once again, I will stress that these stock predictions mean absolutely nothing to me and should mean nothing to you but I’ll tell you what I wrote.

Since I was already compiling a similar watch list on the MSW Weekly Screens, I decided to go with a few young stocks that seem to be trending higher, near new highs with products or services in demand. A complete CANSLIM approach when you think about it!

I have stopped trading for the year due to the holidays, visiting family in NY, family coming to NJ and the New Year bash at my house. Bash might not be the right term.

Even though I have stopped trading, I have not stopped my research so I can step right into the game come January. I am searching for stocks that are trending higher, have increasing earnings and are fairly young to the stock market (IPO’s within the past several years).

Here are the five stocks that I am watching for early 2007 and the exact stocks I selected to outperform in 2007 on the survey. Don’t listen to me, listen to the stocks and act accordingly because predictions are typically wrong!

Iconix Brand Group
ICON – 19.82, the ideal entry for this stock is near $17.50 or the 200-day moving average. Volume has been increasing as the stock has been trending higher over the past 18 months. I do expect a consolidation period before the next advance but that is just my opinion. Let the charts tell you what is happening.

121806_icon_weekly.png

Nymex Holdings, Inc.
NMX – 129.01, a young sister stock of CME, ISE, ICE and BOT. Based on the success of the others, I have no reason to expect any less out of this recent IPO. The stock is currently ticking higher over the past couple of weeks but there is still a lack of technical data to get a true picture. A stock I will definitely be watching in 2007 based on my success in ISE and ICE.

121806_nmx_weekly.png

Jones Soda Company
JSDA – 10.03, as mentioned last week, Jones is a low priced sister stock of Hansen Natural (HANS) which has potential of a nice move and possible up-trend in 2007. The Ideal entry area is along the 200-d m.a. with shorter term entry points along the 50-d m.a. and above $10.50 on the point and figure chart

121806_jsda_weekly.png

Comtech Group Inc.
COGO – 18.50, Comtech is trending higher but is now extended from the 200-d m.a. with a reversal to end the week. Volume has been increasing while the stock reached and floats near new high territory. The ideal entry area is along the 200-d m.a. with shorter term entry points near the 50-d m.a.

121806_cogo_weekly.png

Knot, Inc.
KNOT – 27.45, the stock has made multiple daily and weekly screens (MSW Index) over the past year but I removed it earlier than I should have. I made a mistake and explained that in detail in a blog post this past fall. It’s currently extended from the 200-d m.a. and has been trending higher for two straight years. The next ideal entry will be closer to the 200-d m.a. if the stock shows support.

121806_knot_weekly.png

Tuesday’s MSW Daily Screen

Since I posted my first completely positive (longs only) screen last night (in November), I decided to share it with everyone on the blog. I still view the market as extended but it is trending higher and until that trend is snapped, shorting stocks will carry risk (at least shorting them the way I do � following the O�Neil approach from his book on shorting). I will post a list of stocks with charts tomorrow that show similar characteristics to the ones highlighted in O�Neil�s book on shorting.

Many of the market�s leading stocks powered higher Tuesday including several MSW Index members such as:
LVS, ICE, ISE, LRCX, JLL

As explained below, a couple of these MSW Index stocks clearly vaulted past their pivot points which were highlighted on the weekly screen over the weekend. The NASDAQ is now up 1.71% for the week and is far above the former 100% retracement level that was established back in April 2006. If you pull out on the charts and look at a two year weekly view of the NASDAQ, you will see the deep v-shaped pattern with handle and pivot point breakout to new highs (the highest point since 2001). The NASDAQ daily chart clearly shows how the index is climbing along the trend-line I have highlighted in red. Remember, I have been screening shorts over the past several weeks but none of the major indexes have reversed the trend even though they are all extended. Until the trend snaps, we must tread carefully when placing shorts. Due to the extended nature of the market, we must also tread carefully when placing longs or adding shares to current positions.

All major indexes moved higher in above average volume as the recently weak retail sector decided to take some leadership. Looking at my charts through the link below, we can see that small caps are gaining strength versus their larger cap peers. Along with these small caps, many growth stocks are starting to come to the head of the class and flex their muscle just as IBD stresses in tonight�s eIBD edition. IBD mentions how the S&P 600, the small cap index, is within 1% of an all-time high. One of the most impressive numbers of the day was the NH-NL ratio finishing at 613-71 as advancing issues beat declining issues (6,314 to 3,657).

REMEMBER THE �M� IN CANSLIM!
Current Environment: Short term plays (long or short)! The market is extended but trending higher.

Interesting Stocks making New Highs:

  • ICE � 96.55, the MSW Index stock blasted 9.10% higher today on big volume and now has a 31% gain on MSW since 9/23/06. I called for a new buy above $88 this past weekend
  • LVS � 92.00, up another 4.75% today for a 62% gain on the MSW Index since April of this year. The stock is now up almost 30% in the past two weeks. Now in the final stage of the $60-$100 run (lock in all gains above $89 or 75% of the run)

  • TM � 124.82, a six month cup shaped pattern that should form a handle before grabbing new shares. Toyota was screened daily several times near the 200-d m.a. above $100 earlier this year
  • NTY � 33.19, a double top breakout on the P&F chart on above average volume (a 12.32% gain today)
  • EDU � 31.85, an interesting young stock that is trending higher that may be entering extended territory. The support/resistance zone stands at $28
  • CTSH � 79.55, a gap-up to new highs that almost erased during the day before trending higher during the afternoon. The ideal trend buy is still near the 50-d m.a.
  • GROW � 39.64, now up over 8% this week as the stock continues to make new highs. �stocks that make new highs typically continue to make new highs until the major trend is snapped�.
  • NICE � 32.58, the second consecutive gap-up for a total weekly gain of 9.18%. The previous triple top breakout took the stock from $29 to $33 which now acts as the ceiling for the potential double top breakout
  • LRCX � 55.04, up 3.36% today for a total weekly gain of 9.86% on above average volume. The stock blasted past our pivot point of $52.53 and is now up 21.42% on the MSW Index since 9/30/06
  • CTRP � 58.88, the former MSW Index stock is making new highs after becoming a 200-d m.a. play last month. It is up over 20% since mentioned as a 200-d m.a. play in October.

Interesting Stocks within 15% of New Highs:

  • FFIV � 72.07, a very deep seven month base without a handle formation at this point in time. An ideal pivot point will develop after the proper handle formation
  • WCG � 62.20, a trading range between $57 and $64 will determine a buy or sell but note that some heavy distribution weeks cast a dark cloud near new highs
  • ISE � 50.49, the stock has formed the handle to the long term cup shaped base and has a pivot point of $55.23 and support above the 50-d m.a. Up over 4.51% for the week and up almost 17% on the MSW Index
  • TWGP � 33.56, the former MSW Index stock is back above the 50-d m.a. on strong volume. The 200-d m.a. is still the long term support and the up-trend indicator
  • ININ � 18.75, the stock is approaching the $20 level which typically acts as resistance when making new highs so be careful not to chase it into extended territory
  • RVSN � 21.20, a nine month cup shaped base that has completed the right side as it is within cents of the 52-week high (the left side of the base). Look for a handle to form with a pivot point before grabbing shares
  • HWCC � 23.78, a double top breakout has setup on the P&F chart with a short term entry above $25

Piranha

Comeback Kids?

Due to last night’s loss by the Mets, I am going to call today’s screen the comeback kids. I am disappointed today as a baseball fan but I will get over it and look forward to next season with a young group of comeback kids (I also have my Giants playing the Cowboys this Monday night).

Are the stocks below a bunch of comeback kids?

Many of them are only a few years old and are gathering some support near their 200-d m.a. as the market looks to be forming its first pull-back or high handle. The market is overbought and extended so I am cautious with this type of a screen but it is important to look for stocks that can gain support above their 200-d moving average.

Many of these stocks are recovering or gaining price strength above their 200-d moving averages but their volume is not cooperating on the weekly chart which does raise a red flag. The stocks screened are ones that made positive gains yesterday, have respectable relative strength ratings and earnings ratings greater than 70% of their peers. Keep in mind that I may have left some solid candidates off of the list because the screen was only looking for stocks making gains during the day Thursday. All prices quoted are from the end of day Thursday.

Comeback Kids?

  • STLD – 58.69, nice support along the 200-d m.a. with increases in volume. The next short term buy is a move above $60
  • DRQ – 37.84, back above the 200-d m.a. as the stock is gaining some support with increased volume on the daily chart
  • FTI – 60.25, this chart is very similar to the first two stocks listed today as the 200-d m.a. recovery is underway but weekly volume is not above average
  • BRG – 65.84, after five months of consolidation back to the 200-d m.a., the stock is moving higher on increased volume. Could be a $60-$100 setup
  • GPI – 50.16, the stock corrected about 30% from its high and is now trending back above its long term moving average. Short term buy is a move above $52
  • BUCY – 49.40, the recent and former MSW Index stock is back above the 200-d m.a. but volume is lower than the distribution weeks.
  • ANDE – 38.30, the stock has corrected by 50% since its high above $62 and is now gaining support along the 200-d m.a. with a possible deep cup pattern forming
  • EXPD – 48.11, another one of those young growth stocks that corrected to the 200-d m.a. after a nice run and is now trending higher. The trend buy is along the moving averages
  • VMC – 84.20, building a five month cup shaped pattern with recent support at and above the 200-d m.a. Volume has been light so be skeptical.
  • AEM – 33.25, riding the 200-d m.a. with a short term entry on a move above $34. Once again, I would like to see volume increases to confirm the move
  • NTG – 32.72, the stock fell below the 200-d m.a. for the first time in years but is fighting to get back above (volume has been light)
  • OXPS – 30.19, the former MSW Index stock is back above both moving averages and is gaining volume strength on the daily chart but not the weekly chart.
    DB – 123.58, a cup with handle base above the 200-d m.a. with a pivot point of $125.42
  • MDR – 44.36, a long time superstar that has been riding above the 200-d m.a. for the past couple of years with its first challenge of support in September. The stock caught support and is looking to recover its 50-d m.a. but daily volume is low. I would wait for a new 52-week high before becoming interested.
  • DAKT – 22.42, the stock took a hard fall in August back down to the 200-d m.a. but has since caught its footing. The trend buy would be now with proper sell stops in place
  • TTI – 25.95, the stock has consolidated through out 2006 with recent support near the 200-d m.a. and is now attempting to stay above the long term average. Volume has dried up, so watch the RS line carefully
  • HSC – 82.20, a strong stock from 2005, Harsco has consolidated in 2006 and is looking to gain some strength here above the 200-d m.a.
  • ADM – 37.90, a great stock from late 2005 until mid-2006 with a recent correction back to the 200-d m.a. It seems to be getting some support at the long term support line but must recover back above the 50-d m.a.
  • TS – 37.71, one of the top performing stocks on the MSW Index in 2005 and early 2006 but was recently removed due to lack of strength and a declining RS line. It has since recovered the 200-d m.a. and will stay on my radar.

Piranha