Stocks to Watch in 2019

I’ve decided to mix it up this year, rather than repeat the similar trends list from the past several years. Don’t get me wrong, the Stock Trends lists from the past several years have performed amazingly well, I still own shares in several of those names and I continue to recommend many of them going forward.

But I have been watching a new crop of lesser known growth names. These stocks may carry with them more risk as their brands, revenue and social status aren’t at the level of the Stock Trends stocks (i.e.: AAPL, AMZN, V, MA) but the growth potential is what excites me.

I suggest caution if buying shares in early 2019, considering the major indices are trading below their 200-day moving averages. Further, the New High – New Low readings are negative right now so until they can regain positive status, further downside risk is possible.

There are several criteria that I am using to identify the list below: increasing sales, increasing earnings, strong relative strength and IPO’s within the past several years. I’m specifically searching for the next crop of young growth companies that can provide above average gains over the next 12-24 months. I am aware that a few of the stocks listed are lacking in the “relative strength” department.

  • OKTA – $63.80: Okta, Inc. provides identity solutions for enterprises and other businesses, serving in the security software sector, along with companies such as PANW and CYBR.

    Sales have been increasing QoQ by an average of 62% the past 8 quarters, from $48.8MM to $105.6MM (Jan 2017 – October 2018 periods). The stock is still young, with an IPO on April 7, 2017 yet institutional fund sponsorship has increased more than 55% over that same Jan ’17 to Oct ’18 period.

    Technically, the stock made an all-time high back in September, reaching $75.49, before selling off along with the rest of the market, above its 50d and 200d moving averages. The relative strength rating is currently 98, showing that the shares are holding up better than most of the market. An ideal area to grab shares in anywhere in the $50 range, above the moving averages. I see OKTA as a classic $60 to $100 mover over the next 12 to 24 months.

  • TWTR – $28.74: Twitter, Inc. operates as a platform for public self-expression and conversation in real time. The company offers various products and services, including Twitter that allows users to consume, create, distribute, and discover content.

    Sales have been increasing the past three quarters (YoY) by an average of 24.6%, from $664MM to $758MM. The stock debuted on the market on November 7, 2013 and I was a big fan of the stock back then but was far too early as they hadn’t figured out how to make money yet. The company has since figured that out as earnings have increased an average of 117% over the past three quarters while institutional sponsorship has increased 59% over the past 4 quarters.

    Technically, the stock made a 52-week high back in June, reaching $47.79, after spending nearly two years in the teens and $20’s. The relative strength rating is currently 77, which isn’t excellent but not terrible. Historically, TWTR has been volatile with some big swings up and down so I don’t recommend the stock for those with a weak stomach for the unexpected. Shares are currently trading below the 50d and 200d moving averages but holding support in the $26 range. Long term, I see this as a $50+ stock so one may start to initiate a position below $30 and be prepared to hold through some volatile times.

  • CGC – $26.87: Canopy Growth Corporation, together with its subsidiaries, engages in growing, possession, and sale of medical cannabis in Canada. Its products include dried flowers, oils and concentrates, softgel capsules, and hemps.

    Sales have increased from $9.8MM in December 2016 to $23.3MM in September 2018, an increase of 137% over 8 quarters. However, earnings are still negative but are poised to become positive in FY 2020. Institutional sponsorship has increased by 157% but the number of holders is still relatively small when compared to most established stocks; to be fair, the stock only debuted on the American market in May 2018 so it will take time before the institutions can accumulate larger positions (I see this as a positive).

    Technically, the stock has been sliding, losing 50% of its value over the past two months, from its all-time high of $59.25. It currently trades below both its 50d and 200d moving averages, not a positive sign. I do believe that CGC will remain one of the faster growing suppliers as states within the US continue to legalize marijuana products. Ideally, I’d like to see a base form over several weeks which would signal a bottom before recommending shares to be purchased. Long term, 12-24+ months, I see this stock having the potential to trade back above the $50 mark.

  • TEAM – $88.98: Atlassian Corporation Plc, through its subsidiaries, designs, develops, licenses, and maintains various software products worldwide. It provides project tracking, content creation and sharing, and service management products.

    Software is hot heading into 2019, and subscription-based companies have been tearing it up for years (i.e: NFLX, ADBE, ADSK, AMZN, etc.). The recurring revenue model is genius vs selling a software package out of a box every few years.

    Technically, the stock made an all-time high coming into October at $98.21 but has since corrected, falling as low as $65 in November before recovering back to the upper $80s (approximately 10% off highs). The relative strength rating is a solid 98 and the stock trades above both the 50d and 200d moving averages, something not many stocks can claim these days. My ideal entry is closer to the 50d ma, which currently sits between $77-$78 per share.

    Fundamentals are strong as well, with quarterly earnings averaging 37.5% increases YoY over the past 6 quarters and sales averaging 40% increases YoY during that same period. Sales have gone from $148.9M in the December 2016 quarter to $267.3MM in the latest September quarter. Annual earnings are projected to go from $0.52 in FY 2018 to $0.78 in FY 2019 and $0.97 in FY 2020.

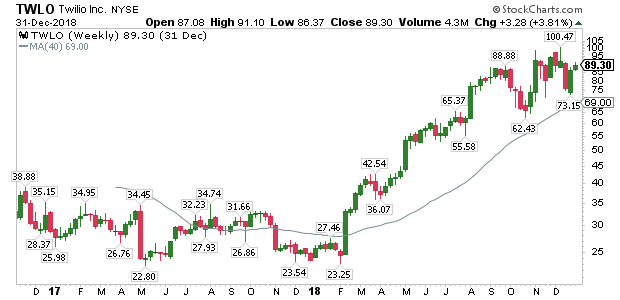
  • TWLO – $89.30: Twilio Inc. provides a cloud communications platform that enables developers to build, scale, and operate communications within software applications in the United States and internationally. The company’s programmable communications cloud provides a set of application programming interfaces that enable developers to embed voice, messaging, and video capabilities into their applications.

    With a 99 relative strength rating, TWLO is one of the top performing stocks over the past few months, trading above both its 50d and 200d moving averages. Sales have averaged a 47.9% quarterly growth rate (YoY) over the past seven quarters, with the largest growth period last quarter, at 68%. Sales have grown from $87.4MM in March 2017 to $168.9MM in September 2018. Earnings turned positive in the June 2018 quarter, $0.03, and followed that up with a $0.07 quarter in September 2018 (the previous five quarters were all negative). Institutional holders have increased 146% over the past eight quarters.

    The stock made an all-time high of $100.47 in December but pulled back more than 25% to $73.15 before settling about 11% off highs, just shy of $90. The ideal accumulation zone is either along the 50d ma (currently $82 range) or just above the 200d ma (currently $66 range). I’m not sure if the stock will retreat back to the 200d ma so accumulating shares in the $80s is fine for now.

  • SEND – $43.17: SendGrid, Inc. operates as a digital communication platform in the United States and internationally. Its cloud-based platform provides various tools to the businesses, including developers and marketers to reach their customers using an email.

    SendGrid has a 98 relative strength rating for a stock that debuted in November 2017 with a 100%+ move since IPO. The risk with SEND is the fact that it has not had that first correction phase since the IPO, something I prefer to see in a young stock, before a long term sustained run.

    That aside, sales have averaged a 36.5% quarterly growth rate (YoY) over the past seven quarters while actual figures have grown from $24.8MM in March 2017 to $37.2MM in September 2018. Earnings have grown 100%, 400%, 100%, 400% and 150% the past five quarters (YoY), going from $0.01 to $0.05. Projected earnings for the stock are expected to be $0.16 in FY 2018 and $0.21 in FY 2019 (from $0.08 in FY 2017). Institutional holders have increased 135% over the past four quarters. SEND is in the same industry as TEAM.

    Similar to TWLO, SEND is trading about 11% off of its all-time high, which was set back in December at $48.41. The ideal buy is near either of the major moving averages, which are at $39.88 and $32.21 respectively.

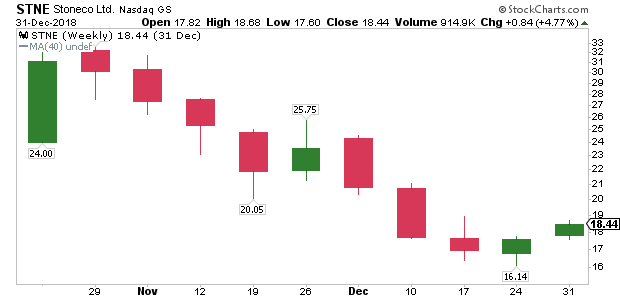
  • STNE – $18.44: StoneCo Ltd. provides financial technology solutions that empower merchants and integrated partners to conduct electronic commerce across in-store, online, and mobile channels in Brazil.

    I’ve been a big fan and holder of financial solutions and credit companies for years (i.e.: Visa, Mastercard, Square) so naturally, STNE grabs my attention. Sales have increased an average of 91% per quarter (QoQ) over the past seven quarters (moving from $52.4MM to $103.7MM), while earnings are up 200%, 600% and 700% the past three quarters respectively.

    The stock is new to the market, IPO date of 10/25/18, which carries with it some risk as there’s no history of action. The stock is down 45% from its 52-week high which took place IPO week but the fall has happened as the market folded. I am basing this selection off of its future potential where yearly earnings are projected to go from $0.05 in FY 2017 to $0.32 in FY 2018 and $0.80 in FY 2019.

  • NIO – $6.37: NIO Inc. designs, manufactures, and sells electric vehicles in the People’s Republic of China, the United States, Germany, and the United Kingdom. NIO is a competitor of TSLA, a stock that I have highlighted on Stock Trend lists for years. I went with NIO this year because I have grown somewhat suspect of the financials over at Tesla. Perhaps there’s nothing there but my gut seems to think otherwise, we’ll see (I do not own shares in TSLA as of this writing). With that said, it’s tough to show confidence in Chinese based companies as their financials are often suspect as well.

    As of now, I own call options in NIO which expire in February 2019 but I do not own straight shares. Why, because I don’t have enough technical and fundamental data to base my decisions on, other than pure speculation that NIO will be a player in the exploding global electric vehicle market. Consider that the Chinese population is 4.3x the size of the US, that’s what gets me interested in this company.

    Per Forbes, Chinese demand for EVs is expected to eclipse 1 million units in 2018, about half the world’s total. That number will go to 5 million by 2025, propelled by government quotas and incentives. The ES8 starts at $67,000 which is about half the cost of an imported Tesla Model X (after tariffs). So where do we buy? Here, based on pure speculation over the next several years. If the company has substance, I can see shares pushing towards $20 in the distant future or 3x from the 2018 close.

  • IMMU – $14.27: Immunomedics, Inc. is a bio-pharma company that focuses on the development of products to treat cancer, autoimmune disorders and other diseases. The company has been focusing on commercializing sacituzumab govitecan as a third-line therapy for patients with metastatic triple-negative breast cancer with an FDA decision due by January 19th.

    The play is a risk, pending FDA approval. The stock made a 52-week high back in July at $27.33 but has been beaten down recently due to some faulty information that was submitted to the FDA. I do have concerns based on this news and a recent class-action lawsuit filed due to the untimely non-disclosure of this information. I am currently a shareholder, dating back to December 2017 and plan to hold through the FDA decision. Provided the company gets approval, I plan to hold long term unless circumstances change. Without approval, the stock is likely done (I will sell immediately). With approval, I expect their drug to bring in strong sales thus boosting earnings QoQ and YoY for quite some time.

    Institutional sponsorship has increased 44% over the past four quarters and 155% over the past eight quarters, which makes sense as the stock moved from a low of $2.02 to a high above $27 (1,200%+ move). Using pure technicals, there is not a signal to buy shares now, rather it’s all based on FDA speculation.

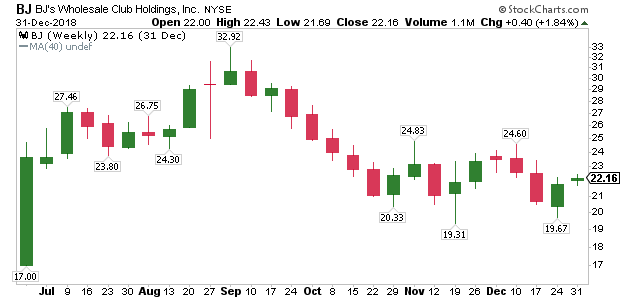
  • BJ – $22.16: BJ’s Wholesale Club Holdings, Inc. operates as a warehouse club on the East Coast of the United States. It offers perishable, edible grocery, general merchandise, and non-edible grocery products. I am familiar with BJs and Costco living in NY and NJ as they are similar stores but I am only a member of COST (I do think it’s better).

    The stock IPO’d on June 28, 2018, hoping to follow in the footsteps of Costco which has been a great stock over the past 10 years. I can see BJ’s shares doubling, from current levels, over the long term but they need to increase sale’s growth and locations. Costco, a much larger company, has been growing sales more quickly, by an average of 11% QoQ over the past 6 quarters while BJ’s has only been growing sales by 4.3% over that same period. On the flip side, Costco earnings have grown by an average of 18% while BJ’s has grown by 145% over that same period. As of last quarter, 2,137 intuitional holders had positions in COST while only 249 holders had shares in BJs. BJs has room to grow if they can execute properly.

Honorable Mentions:

  • ALRM – $51.87: same industry as TEAM and SEND
  • COUP – $62.86: same industry as TWLO
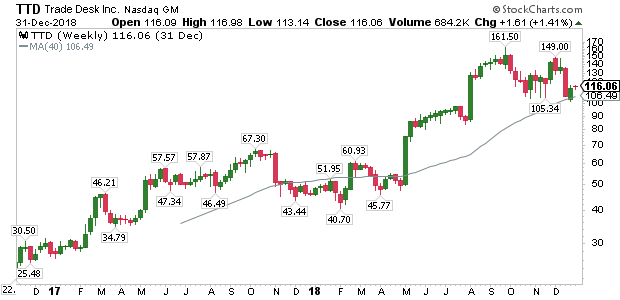
  • TTD – $116.06
  • PAYC – $122.45: same industry as TWLO

Previous Stocks Trends Lists:

January 1, 2018: Stock Trends for 2018

January 2, 2017: Stock Trends for 2017

January 18, 2015: Stock Trends for 2015

My Wife’s Mutual Fund:

Original Post:
August 6, 2014: My Wife’s Personal Mutual Fund Outperforms the Pros

Follow-ups:
February 21, 2016: My Wife’s Personal Mutual Fund Crushes the Markets, AGAIN

August 7, 2016: My Wife’s Buy & Hold Strategy Still Crushing the Professionals

November 19, 2017: The Wife’s Stocks Outperforming 3 Years Later

November 11, 2018: My Wife Picks Stocks better than You

My Wife Picks Stocks better than You

Four years later and my wife’s stocks are still outperforming the major market indexes. She doesn’t even know it but her spending habits pick far better stocks than most folks I know, including me. My wife doesn’t watch the market, actively invest in the market or care to look at a stock chart but she sure can predict where the money will flow.

On August 5, 2014, I put a collection of stocks together that represent the products and services of companies used most often by not only my wife but our family as a whole. I called it “My Wife’s Mutual Fund” and decided to treat it as a personal ETF or mutual fund that we would just hold over time.

Original Post:
August 6, 2014: My Wife’s Personal Mutual Fund Outperforms the Pros

Follow-ups:
February 21, 2016: My Wife’s Personal Mutual Fund Crushes the Markets, AGAIN

August 7, 2016: My Wife’s Buy & Hold Strategy Still Crushing the Professionals

November 19, 2017: The Wife’s Stocks Outperforming 3 Years Later

Every one of these companies are a household name selling a product or service that we all use, so naturally, they will grow as a group.

As of November 11, 2018, the 22 stocks have performed as follows (for purposes of the exercise, no trades have been made):

  • Total gain of 108.26% (adjusted for dividends & splits)
  • 20 of the 22 stocks show a gain
  • 20 of the 22 stocks show a double digit gain
  • 13 of the 22 stocks show a gain of at least 50%
  • 8 of the 22 stocks show a gain greater than 100%
  • The leading gainer, also the 2nd highest initial priced stock, is up 448%: Amazon $AMZN
  • 2 stocks show a loss: $XOM and $KORS
  • A 91% success ratio

As a comparison, the return from the Nasdaq trails by 35%, the DJIA trails by 46% and the S&P 500 trails by 58.5%. In dollar terms, $5,000 invested per stock in the portfolio (or $110,000) would currently sit at $229,088 for a pre-tax profit of $119,088. Alternatively, $110,000 placed in the Nasdaq would result in a pretax profit of $77,178, $64,005 for the DJIA and $49,311 for the S&P 500.

What started as a playful review, became a serious pursuit of stocks that we decided to grab shares in. We don’t own every stock on the list but we do own and have owned many over the years.

I agree with my sentiment from last year, now nine years into a run from the bottom:

I’m not surprised to see, after years and years of gains (pre-2014), that these stocks continue to outperform the general market indexes. At this point in 2017, I believe that many of these stocks will continue to outperform in the years to come (and I’m making this statement deep into a multi-year up-trend).

Many folks and gurus on social media try to get fancy and make predictions to actively buy and sell the next great thing. Perhaps that works (not likely) so why not just accumulate shares in the best companies with the most useful products and services and call it a day. Predictions are fun and subscriptions must be sold so fintwit activity is needed but I bet this buy & hold portfolio has beaten the results of most strategies. And the best part, it’s free.

Howard Lindzon (@howardlindzon or howardlindzon.com) has a very similar list titled 8 for 80 which shares several of the names listed here. What he says about his list rings true for any list:

“No index or list is perfect…and mine will keep evolving. The secret sauce over time is not so much the list itself, but the ability to adjust, allocate and manage risk as you go.”

At the end of the August 2016 update, I suggested changing $KORS (an underperformer) for $MSFT. For purposes of the blog thread, we didn’t change a thing but that one adjustment would have resulted in a 98% gain for MSFT vs the 5% additional loss for KORS. To Howards’s point…”adjust”.

The portfolio of 22 stocks:
$AAPL – Apple
$SBUX – Starbucks
$GOOGL – Alphabet
$AMZN – Amazon
$FB – Facebook
$COST – Costco
$TGT – Target
$TPR – Tapestry (formerly Coach, COH)
$KORS – Michael Kors
$CVS – CVS Health Corp
$NFLX – Netflix
$DIS – Walt Disney Co
$JNJ – Johnson & Johnson
$PG – Procter & Gamble
$V – Visa
$MA – MasterCard
$PEP – Pepsico
$TJX – TJX Companies
$HD – Home Depot
$VZ – Verizon
$XOM – Exxon Mobil
$WFC – Wells Fargo

How to Spot a 2018 Trend Change or Market Top

Market tops take time to form, just look back at history and review the progressions of the previous setups.

When reviewing the 2007-2008 market top, it’s clear to see that the setup took six full months. Even then, the market bounced around for another four months but it was clear that the trend had changed, as the 200 day moving average had already started to trend downward and switched to resistance rather than the previous support it provided.

Looking at the DJIA, we can identify six progressions over the course of six months

  1. The index made a new high in July 2007
  2. It challenged the 200d ma in August, only to capture support
  3. Another new high was made (above the July high) in October 2007
  4. By November, the index broke below the 200d ma – NOTE: the 200d ma was still trending higher at this time
  5. The DOW then recovered the 200d ma but failed to recover new highs, a red flag in December
  6. By the end of the month, the DOW broke back below the 200d ma on above average volume, a clear sign that this market was headed for a correction
  7. The market made a final attempt to recover the 200d ma in April and May of 2008 but failed again, but much lower than the summer highs of 2007. If one hadn’t sold yet, this was another clear red flag to protect profits and move to the sideline (the market dropped another 50% from here).

A similar setup and duration took place with the Nasdaq market top in 2000.

Looking at the COMPQ, we can identify eight progressions over the course of six months

  1. The index made a new high in March 2000
  2. It challenged the 200d ma in early April, capturing temporary support
  3. The index tried to recover the 200d ma throughout April but that was short lived
  4. By May, the index broke back below the 200d ma – NOTE: the 200d ma was still trending higher at this time
  5. Tow months later, in July 2000, the COMPQ was working its way high, above the up-trending 200d ma but was still 17% off of it’s all-time highs, a lack of strength (market churn).
  6. By late July, the index closed below the 200d ma
  7. The COMPQ recovered the 200d ma for the third time in August but once again failed to trade above the previous high in July and nearly 20% below the all-time high set back in March.
  8. Lastly, the COMPQ dropped back below the 200d ma in September 2000, as the long term moving average started to trend downward, the first time in years.

By studying the major corrections of the past, a patient investor should be equipped to analyze the necessary and relevant data, recognize if a correction is normal or spot the technical red flags that will confirm a change in trend (i.e.: major correction).

A long-term investor must accept that they will NOT get out at the top but remain confident that they can avoid the bulk of the downturn. By studying the 2000 and 2007 markets, a long-term investor should be able to sell within 20% of the market top and well before the ensuing additional drop (which was greater than 50% in 2000 and 2008).

NOTE: The New High – New Low Ratio is another key indicator that substantiates the move, one way or another, but I will leave that specific analysis for another post. As it stands today, the NH-NL 10-d Diff is still positive.

As for the 2018 market, if anyone wanted a lesson in market psychology, it was on real time display as the calendar turned to February. The main stream media and scores of people on fintwit stared to freak out as the market started to sell off with 1,000 pt drops (less than 5% drops).

I posted this chart to Twitter & Stocktwits on February 5, 2018, which highlighted the previous drawdowns for the DJIA over the prior two years. I posted it to show that the 200d ma was still trending higher and that investors should welcome a normal correction, in-line with the previous 8%-19% drawdowns.

Further, the percentage of stocks trading above the 50-d ma started to drop rapidly, signaling a short term oversold signal, as this chart showed, posted on February 11, 2018.

I’m not ready to call a market top or change in long term trend but I am watching. What I have learned is that a market top or change in trend will likely take some time with several back-and-forth struggles between buyers and sellers.

Until the market confirms (continuation of the up-trend or a change in trend), hold tight with the stocks in your portfolio that are performing well. Specifically, hold the stocks that are trading near new highs and/or have strong relative strength ratings.

As for the stocks that start to fail, below their respective 200-d ma’s, considering selling a portion or all of that position.

The last chart shows possible progressions, not that it will follow the exact points that I have created here but look for something similar and WATCH the 200d ma.

Let’s see what this market wants to do.
$DJIA $COMPQ $SPX

Stock Trends for 2018

If you thought my Stock Trends for 2017 list was boring (same old stocks), just wait until you see the creativity of this year’s list. I said this last January 1st:

“Perhaps this list is old and boring (Buffett likes boring) but we’re here to make money, not be sexy.”

So, let’s get into the mind of Buffet, which will explain why I am going to “let it ride” for now…

“There seems to be some perverse human characteristic that likes to make easy things difficult.”

“Only buy something that you’d be perfectly happy to hold if the market shut down for 10 years.”

“It’s far better to buy a wonderful company at a fair price, than a fair company at a wonderful price.”

Many of the stocks that I profiled in 2017, were the same old stocks that I profiled in 2016 and 2015. Following the trend has worked well so why should I try to get fancy, chasing a few percentage points here and there while increasing my risk? The 2017 portfolio returned nearly 42% and the basis of the setup didn’t include any sophisticated buy and sell rules. It was a simple buy and hold strategy. I’ll take 42% any year, hands down!

The current market run from the bottom in March 2009 will reach nine full years in 60 days. It has been an amazing run with amazing stats along the way. At some point, the trend will end. Unfortunately, no one knows if that will happen tomorrow, sometime in 2018 or at some point beyond 2018.

Take a look at these amazing S&P 500 stats:

  • The S&P 500 has had nine consecutive positive return years, tying the all-time record from 1991-1999 (we all know what happened in 2000).
  • Every month was positive for the S&P 500 in 2017, setting an all-time record, the first time that has ever happened in the history of the index.
  • In fact, the S&P 500 has been positive for 14 consecutive months, another all-time record.
  • The S&P 500 has been positive 14 of the last 15 years with only 2008 showing a loss.
  • The S&P 500 went 17 out of 18 years from 1982 to 1999, so perhaps there’s still room to run.

On the surface, the S&P 500 stats referenced sound like the end could be near but the famous quote:

“Markets can remain irrational longer than you can remain solvent”

keeps me from trying to guess. The “easy” thing to do is to continue playing until the market tells us otherwise. No one is smarter than the market and it will give signals when it’s over.

So, before I get into this year’s list, I once again suggest that 99% of all investors stick with low cost index funds and skip individual stocks altogether. Individual stocks are funny and carry too much risk for the casual investor.

*NOTE: the overall health of the markets must be positive for many these investments to do well.

Digital Currency & Blockchain:
Digital Currency has been on my list for several years and has worked well. I mentioned “blockchain and bitcoin” both in 2015 and 2017 but decided to ignore them as far as investments. Too bad for me as 2017 was the year of cryptocurrency.

Blockchain started to go mainstream in 2017 and I believe the mania will continue in 2018. The challenge with crypto currencies (coins, alt coins, tokens, etc.) is that 99% of the ones available today will not be here in the future, they are garbage or outright scams. Some may survive and new ones will be created but I suspect the leaders of these decentralized cryptos will start to emerge by the end of 2018. I am far from an expert on cryptos so please search elsewhere for advice on how and where to invest. The hope for crypto (and blockchain) is that the “technology” eventually supersedes the speculation and the intended benefits will be realized. (Disclaimer: as of this blog post, I own Bitcoin, Ethereum and Litecoin).

For a more traditional stock approach, these are the companies that I believe will continue to provide value and further upside through their stock shares:

  • V: 114.02. I continue to ride and hold Visa personally as it remains the world’s largest retail electronic payments network and is one of the most recognized global financial services brands. The stock returned 47% in 2017 and has been in an up-trend, above its 50-day moving average since last January. The stock provided a much better entry in January 2017, from a technical standpoint, but I am including again this year. As I said last year: “as a long-term shareholder, I’m holding, until it proves otherwise.”
  • MA: 151.36. Like Visa, MasterCard was also up over 47% in 2017 and has been riding its 50d ma since August 2016. The stock is currently trading sideways over the past several weeks, forming a base along the 50-d ma. My ideal buys are closer to the 200d ma but I will include Mastercard until it breaks down. Be careful buying any stock when extended.
  • SQ: 34.67. Square, Inc. was the one that got away last year. I went with PayPal (stocked up on $PYPL shares personally and it paid off with an 86% gain, I still own 50% of my original position). Personally, I still like PayPal (the company) but feel that the stock is extended so I am not including this year. I am going to take a chance on Square, a stock that went from $13 per share to as high as $49 per share in 2017. The stock has pulled back over the past five weeks, violating the 50d ma on heavy volume so we have to keep an eye on that (red flag). An ideal area to grab shares would be at or near the 200d ma, as long as it holds support. A violation of the 200d ma would be a big red flag. With all that said, I am going to take a chance on SQ. It carries with it some risk so be careful if you decide to grab shares.

[Read more…]

Stock Trends for 2017 Final Results

The results are in and the chrisperruna.com Stock Trends for 2017 outperformed the general market by a wide margin. The discretionary buy-and-hold (mock) portfolio logged final gains that were 48% larger than the Nasdaq, 66% larger than the DJIA and 115% larger than the S&P 500.

Final 2017 Results:

  • Stock Trends for 2017: +41.85%
  • Nasdaq Composite: +28.24%
  • Dow Jones Industrial Average: +25.08%
  • S&P 500 Large Cap Index: +19.42%

Final Results Fun Facts:

  • 20 of the 21 stocks show a gain for a 95% win ratio
  • 18 of the 21 stocks show a double digit gain or 86% of the stocks
  • 14 of the 21 stocks outperformed the three main US indexes
  • 8 of the 21 stocks gained more than 50% for an average of +69.23%
  • 6 of the top 10 gainers started as triple digit stocks (7 ended that way)
  • The top 10 performers had an average gain of +65.00%
  • The average gain of the positive stocks is +44.39%
  • The average gain of the positive stocks, with double digit gains is +49.16%
  • BABA was the top performing stock, with a gain of +96.37%
  • BABA peaked at $191.75 (52-week high), which gave the stock a +118% gain at the time

As 2017 ends, I maintain a bullish outlook on many of these names, heading into 2018 and beyond.

**Note: Adjusted close price adjusted for both dividends and splits.

Stock Trends for 2017 Portfolio:
$AAPL $AMZN $BABA $BCS $CYBR $FB $GOOGL $HACK $INTC $MA $MBLY $MIME $NFLX $NVDA $PANW $PYPL $TSLA $USO $V $VNTV $XME