PEG Ratio
A PEG ratio cannot be used alone but is a very powerful tool when integrated with the basics (price, volume and technical analysis). You must enjoy crunching numbers and have a calculator or spreadsheet handy to estimate your own PEG ratio. Access to quality statistical information from the web such as past earnings and future earning estimates is essential to calculate this fundamental indicator. A variety of websites produce a PEG ratio but I have not found one site that has a reliable PEG ratio that I can use for my own research, so I calculate it myself, ensuring accuracy with the final number. Besides, I don’t know what earnings numbers these sites are using to determine growth rates and price-to-earnings ratios.
Investopedia.com:
“The PEG ratio compares a stock’s price/earnings (“P/E”) ratio to its expected EPS growth rate. If the PEG ratio is equal to one, it means that the market is pricing the stock to fully reflect the stock’s EPS growth. This is “normal” in theory because, in a rational and efficient market, the P/E is supposed to reflect a stock’s future earnings growth.
If the PEG ratio is greater than one, it indicates that the stock is possibly overvalued or that the market expects future EPS growth to be greater than what is currently in the Street consensus number. Growth stocks typically have a PEG ratio greater than one because investors are willing to pay more for a stock that is expected to grow rapidly (otherwise known as “growth at any price”). It could also be that the earnings forecasts have been lowered while the stock price remains relatively stable for other reasons.
If the PEG ratio is less than one, it is a sign of a possibly undervalued stock or that the market does not expect the company to achieve the earnings growth that is reflected in the estimates. Value stocks usually have a PEG ratio less than one because the stock’s earnings expectations have risen and the market has not yet recognized the growth potential. On the other hand, it could also indicate that earnings expectations have fallen faster than the Street could issue new forecasts.”
PEG Ratio Example:
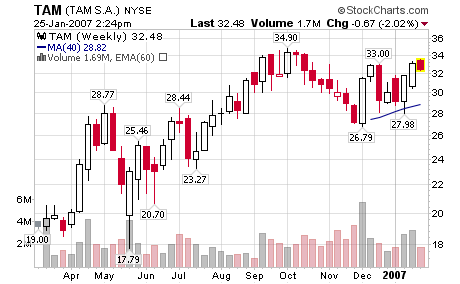
TAM S.A. (TAM)
Yahoo Company Profile: TAM S.A., through its subsidiaries, provides scheduled air transportation services in Brazil and internationally. The company engages in the transportation of passengers and cargo within Brazil and on international routes. It offers flights serving various destinations in Brazil, as well as operates scheduled passenger and cargo air transport routes to 46 cities, in addition to a further 27 domestic destinations that the company serves through regional alliances with other airlines.
First, you will need to gather the past earnings numbers; going back a couple years and going forward a couple years. Keep in mind that the numbers going forward are only estimates and that is why this is only a secondary tool to help predict a future price or target.
TAM Earnings:
2005: 1.30
2006: 2.58
2007: 2.86
2008: 3.14
We need to calculate the growth from year to year.
Subtract the earnings of 2006 by 2005 and then divide by 2005.
Repeat the process to determine the growth rate for the following years:
2006: (2.58-1.30)/1.30 x 100 = 98% growth rate
2007: (2.86-2.58)/2.58 x 100 = 11% growth rate
2008: (3.14-2.86)/2.86 x 100 = 10% growth rate
Take the current price (we will use the close from Wednesday, January 24, 2007: $32.62) and divide it by 2006 earnings and then by the 2006 growth rate:
2006: 32.62/ 2.58 / 98 = 0.12 PEG Ratio
2007: 32.62/ 2.86 / 11 = 1.03 PEG Ratio
2008: 32.62/ 3.14 / 10 = 1.04 PEG Ratio
Using the definition from above, Investopedia states that a stock is evenly valued at a PEG ratio of 1 in a rational and efficient market. Please note that the stock market is not very rational or efficient so we only use this number as a secondary indicator and tool, after our fundamental and technical analysis is complete.
Once you determine the PEG ratio of the stock you are looking to buy, take the time to calculate the PEG ratio for the “sister stocks” in the industry group to see if they have higher or lower PEG ratios. Keep in mind, PEG ratios don’t work for companies with negative or non-existent earnings numbers.
Do you want to implement a PEG strategy into your fundamental arsenal; then think about this very basic example?
Let’s say we are looking at two stocks to purchase with these similar characteristics:
They are both trading near $20 per share.
Both stocks have a P/E ratio of 20 (they are trading at 20x’s their earnings)
The first stock grows earnings at a 10% annual rate
The second stock grows earnings at a 20% annual rate
Watch how the price will change in the future assuming that the P/E ratio remains unchanged:

Stock ABC:
Starting Price: $20
Annual Earnings: 1.00
P/E: 20
PEG: 2.0
Stock XYZ:
Starting Price: $20
Annual Earnings: 1.00
P/E: 20
PEG: 1.0
Price in One Year:
Stock ABC: $22
Stock XYZ: $24
Potential Price in Three Years (based on Growth Ratios):
Stock ABC: $26.62
Stock XYZ: $34.56
* Using this very basic example, we can see that stock XYZ with the 1.0 PEG ratio should outperform the stock with the 2.0 PEG ratio due to the earnings growth rate. This is not guaranteed but can help when looking to make a purchase between two similar stocks.


Chris, with the extraordinary amount of stock buybacks we’ve seen over the last 18 months or so, would you make any adjustments for the effect of buybacks inflating the EPS number? Otherwise, we are going to have a few companies that will appear to have stronger earnings growth when in fact the EPS increase is merely a result of a declining outstanding shares denominator in the EPS calculation.
I don’t pay too much attention to this because I study the entire financial statement of the company I am researching and will notice special situations based from all the fundamentals together.
Chris,
Great article about the PEG ratio and its application. I use PEG a lot as one of my inputs for my neural net stock picking model.
Great article. The example, however, would imply that, all things being equal, value stocks are the better option. According to this, the lower PEG has the potential to vastly outperform the higher PEG. Is there a market condition or an environment where this would NOT be the case, where a lower PEG would prove detrimental?
Chris — Your calculation of PEG is different than any I have seen before. Your Investopedia quote says PEG is P/E ratio divided by EXPECTED growth rate. Your 2006 value of PEG is using a hindsight growth rate.
One problem with PEG, if it is used with a projected 5-yr growth rate, is that many of the under-followed stocks in the small-cap universe have no analysts’ projections, therefore a screen for PEG will miss them.
If it’s used with a historic growth rate, it will tend to pick up peaking cyclical stocks, i.e., their earnings growth has already happened, and the low PE is the market discounting future shortfalls in earnings.
That being said, I like the PEG but usually if I’m interested in a stock’s growth prospect I will hit it with a DCF to see if the PE looks fair.
About buybacks – it would be very rare for a buyback to materially impact EPS growth. In order to grow the EPS by 10% in a year, the company would have to buy back 8.9% of their outstanding stock in that year! Basically NOBODY buys back that much stock. A super-aggressive buyback is maybe 5% in a year. MAYBE. That would be 5.3% growth in earnings, IF they were that aggressive. You might find a few buybacks that aggressive in any given decade. From my point of view, where I’m looking for extreme values or clusters of anomalies, it’s unlikely
that the buybacks that actually happen move the PEG significantly enough to make it extremely low.
While the PEG ratio isn’t fullproof because the growth rate relies on analyst projections, it is definitely more useful than the P/E. Companies often experience quick jolts in earnings, which send the P/E out of whack very quickly. Plus, forward P/E is more useful if you’re a long term investor. I like to calculate the EPS growth rate of a company using Excel, and track the numbers for a month or two. Since I try not to short term trade (aside from options), it helps me pick up earnings trends w/o solely relying on the pundits. Good post just so you know.