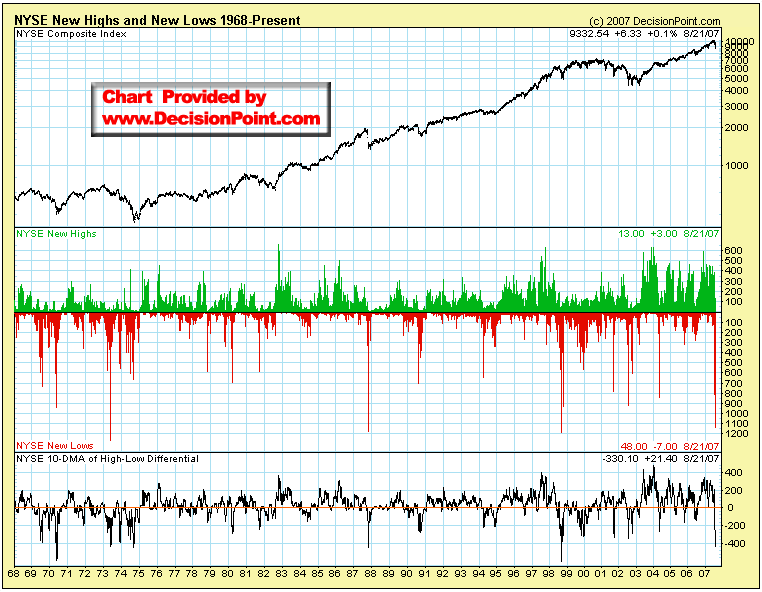
Tonight’s chart comes to us from Carl Swenlin, the President at Decision Point
I want to thank Carl for allowing me to upload the chart that shows the 10-day moving average of the Hi Lo Differential. Another thanks to Mike for leaving me the comment to contact Carl.
*click the image for a larger view*
*Note: I added the “1,2,3” graphics from photoshop*

According to Carl’s data, we must go back to 1998 to find a lower reading than last week’s NH-NL ratio. Even more amazing is the fact that we must then go back 20 to 38 years to find readings in the same vicinity as 1998 and 2007.
Ignoring the spike in 1987, we must visit the 1970’s to find readings below the -400 level on the chart.
*click the image for a larger view*
*Note: Original Chart*
And don’t forget to stop by Carl’s site, Decisionpoint.com


Chris,
Thanks for the posts regarding the differential between NH/NL. Very helpful. Are you familiar with the phenomenon known as the “Minsky moment”? I think we are just now entering that cycle and your NH/NL posts helps to support that.
Chris,
Wow! This offers such a huge insight. This gives a new perspective of what could follow further based on history. Looking at the March correction on the chart hardly registers compared to what is happening now. Very good information here!
Matt,
I have never heard of the “Minsky moment” but I will search it on Google.
Steven,
The chart is excellent – I wish I had access to the database storing this information. I notice a bottom at the 3 extreme points and then an advance for a couple years and then a long downturn in the first two cases. We shall see!
Hi Chris
Amazing article………you are too good. Your site seems to be improving every day. Just had one doubt …….what is a differential………is it the difference between NH and NL or sth else.
Anyways the post is too good.
Thanks
Dian
Dian,
Thank you very much. Differential is the spead between the new highs and new lows. That day had more new lows versus new highs (or differential) in years (since 1998).