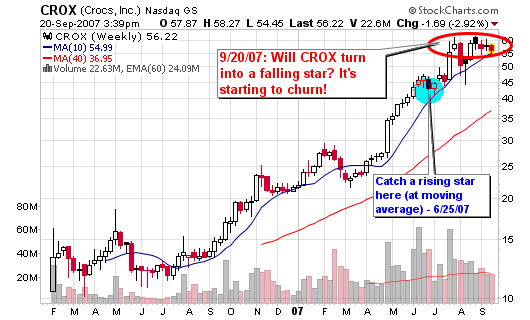
Are we about to jump on a falling star or is this a slight hiccup for the former super star?
I labeled CROX a rising star that I missed in my own portfolio back on June 25, 2007 in Catch a Rising Star.
Recent churning action below $60 per share shows that buyers are no longer in control of the stock. However, sellers haven’t completely gained control either. It is a tug-of-war between supply and demand as we await the ultimate direction of the next trend for the heavily covered Crocs Inc. (CROX).
I wrote this on my Daily Screen on Friday, September 7, 2007:
CROX – 58.40, the stock seems to be hitting some resistance near $60 but that is quite normal in this area. Look for a pullback of 10%-20% with support above the 200-d m.a. If is holds the support, develop a strong risk-to-reward trade setup and pounce with a possible $60-$100 run in the future.
It has been eight weeks of sideways action as CROX did not participate in the party that happened on Wall Street after the Fed announcement. Stocks such as BIDU continued to party while CROX has decided to take a breather.
So, what do I think? Don’t listen to me because I am biased and hate the look of those ugly shoes. I hate them even more since I never owned the stock while it ran up more than 300% over the past twelve months.
Listen to what the Institutional Buyers are Saying (with their actions):
Held by Institutions: 557
Money Market: 241
Mutual Fund: 304
Other: 12
New Positions: 172
Positions Sold: 75
Shares Held: 104.9 mil
Shares Held Previous Period: 118.1 mil
Shares Bought: 28.5 mil
Shares Sold: 41.7 mil
Value of Shares Bought: $1.68 bil
Value of Shares Sold: $2.46 bil
So, there you have it. It starts off by looking good with 97 more buyers than sellers. But, the rest of the data doesn’t paint such a bright picture:
- The number of shares held has decreased by 12%
- The number of shares sold exceeded the number of shares bought by 46%
- The value of shares sold was $776 million more than bought
Someone is getting off this rising star! Now, the question remains: Will this former rising star turn into a “thing of the past” falling star? CROX looks like a fad to me because the shoes are hideous but they make a TON OF MONEY! I am no longer confident about a long position but I CAN’T take a short point of view either. Not until the signal bell rings! If it confirms, JUMP ON IT – IN EITHER DIRECTION!
WE TRADE TRENDS, NOT OPINIONS SO LOOK FOR THE SIGNAL!


There have been so many times in the past couple of years that I have thought I should buy that stock, then decided not to because of the worry it already ran too far and was due to selloff first. I’m definitely not the one to predict where CROX will go next, but it certainly is at an important point.
isn’t your data 3 months old? institutional holdings aren’t updated daily, usually at quarter end right?
It is the latest available. What does it matter – it was correct. Besides, institutions take months to sell millions of shares, not a day or two (or week for that matter).
but the data you’re presenting was actually the result of sales done 3 months prior, which moves the selling back to your “catch a rising star” point…
Akbar,
The report from 3 months back may only be the beginning of a long selling mode. As you can see, the selling has continued.
Here are my latest numbers:
Held by Institutions: 569
Money Market: 241
Mutual Fund: 316
Other: 12
New Positions: 169
Positions Sold: 105
Shares Held: 99.85 mil
Shares Held Previous Period: 118.1 mil
Shares Bought: 26.25 mil
Shares Sold: 44.08 mil
Value of Shares Bought: $1.68 bil
Value of Shares Sold: $2.83 bil
Hi Chris, where can we get information on number of shares held by institutions current period vs previous period.
now you’re showing data from nov 1 – 3 months lag = aug 1. oh boy.
akbar,
Don’t know what your problem is but you obviously don’t understand something here. The data in my comments is from October 1, 2007 from Vickers Research.
If you have something better share it! But I am sure you don’t. Either way, the data was correct and always is on the up or down side. See all case studies on blog.