I received a comment questioning if the 1987 Market Crash was detected by the NH-NL data following my blog post titled Nail Market Tops and Bottoms by Doing this, Guaranteed!.
When viewing the NH-NL data, much of the first half of 1987 was stable. Readings were mostly positive with a few bouts of light pink (negative readings) in April and May. Although there was some negativity in the NH-NL readings, the 30-d Differential (Diff) did not turn negative in April 1987. It did however turn negative for seven consecutive days in May 1987. The number of days with 100+ New Lows for the year up until the end of May was two (one on April 14, 1987 and one on May 20, 1987, 112 and 109 NL’s respectively).
July 1987 NH-NL Readings for NYSE:
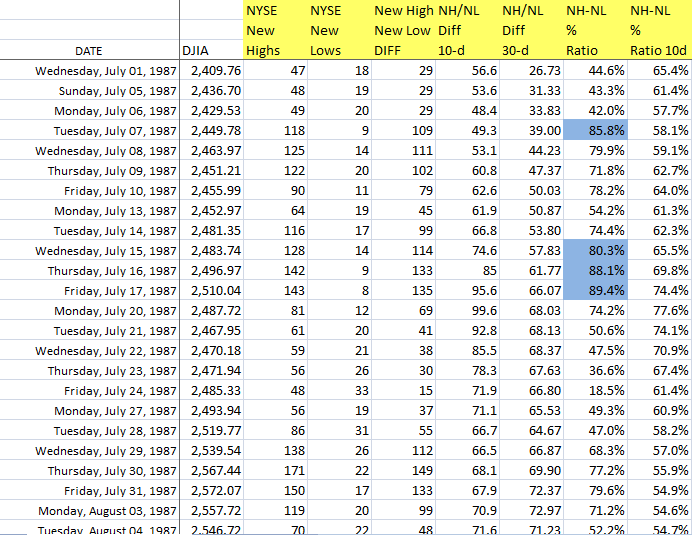
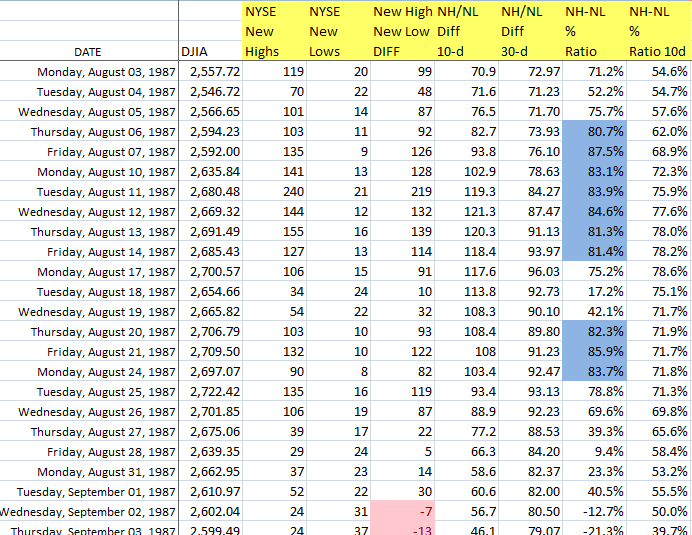
By June, the readings were back to the positive side, averaging a +70 Differential for the summer (June, July and August) with the only negative daily reading coming on June 2, 1987 at 21 NH’s and 28 NL’s or a negative 7 Differential. The next negative day did not occur until September 2, 1987 with a 24-31 reading or negative 7 Differential.
August 1987 NH-NL Readings for NYSE:
Prior to dissecting the NH-NL data, I must iterate that all SEASONED investors should know that they must follow PRICE and VOLUME first and that the DJIA was flashing distribution days throughout the month of September. The NH-NL red flags only back-up the story that price and volume is telling (the NH-NL confirms what the market is doing). In addition to the DJIA showing multiple distribution days, the index closed below its 50-d MA in September. It attempted to cross back above the moving average late in the month but quickly crashed back below it in early October, prior to the crash.
DJIA 1987 – Distribution & NH-NL Red Flags:

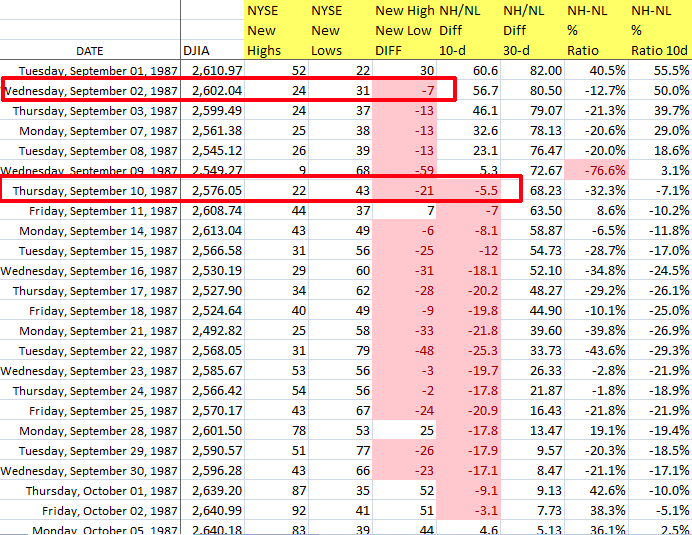
The first big NH-NL clue signaling weakness came in September 1987. For the month, 18 of the 21 trading days recorded a negative Differential reading (the month averaged a negative 15 Diff, marking the weakest month of readings since July 1984 when every day was negative).
September 1987 NH-NL Readings for NYSE:
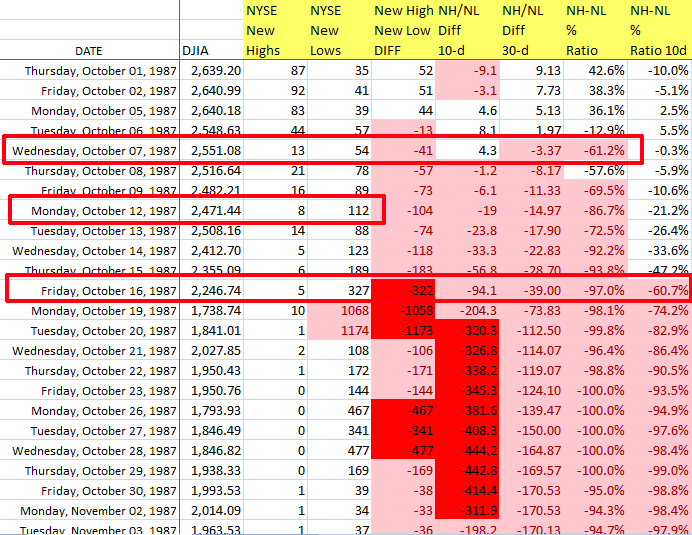
The average daily Differential reading for the first 8 months of the year, through August 31, 1987 was +69.9. As mentioned, the average Diff reading in September 1987 was -15. By contrast, the average reading for October turned out to be a whopping negative 226. The average reading from October 1st through October 16th was negative 70, a complete 180 from the first 8 months.
Below are the key dates that pop out waiving red flags for the longer term trader:
- On September 2, 1987: The NH-NL Differential (Diff) goes red
- On September 10, 1987: The 10d Average Diff goes red
- On October 7, 1987: The 30d diff goes red
- On October 12, 1987: The 1st 100+ New Low (NL) day is recorded
- On October 16, 1987: The NH-NL Diff goes DARK RED which means more than 300+ NL’s
The October 16, 1987 NH-NL reading of 5-327 or a negative 322 was the weakest NL reading since Monday, September 28, 1981 when 590 NL’s were recorded (with only 1 new high).
This was a MAJOR RED FLAG – but was it too late because data is recorded “end of day”?
We all know what happened the following Monday – markets crashed and NH-NL reading settled in at 10 NH’s and 1,068 NL’s for a -1,058 Diff. Tuesday, October 20, 1987 was even worse as the Diff closed at 1 NH’s and 1,174 NL’s for a Diff reading of -1,173.
October 1987 NH-NL Readings for NYSE:
Now, I was still shy of 10 years old in October 1987 so I can’t tell you what I would have done as a trader in real time. However, I can tell you that I watch the NH-NL data, as well as basic price and volume on a daily basis. I will be prepared for the next correction and/or crash and these tools will alert me to capture gains, lock-in small losses and move to the sidelines.
As I said in my post last month, March 2013 is currently sporting:
“…an environment where many pundits are predicting a correction or coming bear market. They may be right but why fight the trend when it clearly points higher. I don’t necessarily disagree with the so called “experts” but I will not make a move until the NH-NL ratio confirms a change in trend. As it stands now, the NH-NL data is logging positive “blue day after blue day”. Until the NH-NL breadth starts logging negative readings on a consistent basis which will in turn change my graphical readings from blue to red, I will not turn bearish. Trends tend to last longer and go further than expected so wait for confirmation.
Here is what we will need to see in the data to confirm a change in market trend has commenced:
- More new lows than new highs
- New low daily readings registering triple digit figures, consistently
- The NH-NL differential must turn negative
- The 10-d and 30-d average differentials must go negative (this is essentially the first sure sign that the market is changing direction – especially the 30-d diff.).
- Differential readings start registering figures larger than -300, -400, -500+.
I will be following the readings and will update my followers on twitter and will certainly post an article on the blog using the graphics to show the change in trend.
By carefully studying the New High and New Low readings, an investor with a longer term time frame can avoid getting slaughtered during a nasty bear market at the beginning, middle and end. This same investor will also be given a green light as to when he should start adding shares after a long hibernation. If a longer term investor ONLY trades based on the major NH-NL signals, he would always outperform the markets and most likely outperform the majority of professional investors.”
The NH-NL data is positive as of March 28, 2013 so trading will continue. Don’t try and predict a market top, let the basic tools tell you when to start moving to the sidelines.
March 2013 NH-NL Readings for NYSE:

NOTE: I am using the same data for my images as highlighted in my March post:
New High – New Low data is historically the most accurate indicator for identifying a major change in trend by highlighting extreme readings and the change in underlying market breadth.
The images contained in this article will identify the following data points:
- NYSE New Highs: The number of stocks making New Highs on a specific date
- NYSE New Lows: The number of stocks making New Lows on a specific date
- New High –New Low Differential: This is simply the number of stocks making new highs minus the number of stocks making new lows.
- NH-NL 10d Diff: This is a simple 10-day moving average representing the number of stocks making new highs minus the number of stocks making new lows.
- NH-NL 30d Diff: This is a simple 30-day moving average representing the number of stocks making new highs minus the number of stocks making new lows.
- NH-NL % Ratio: To calculate the percentage correctly, use this formula: (New Highs – New Lows) / (New Highs + New Lows) * 100 = X%
- NH-NL % Ratio 10d Ave: This is a simple 10-day moving average representing the percentages listed in the column terms #6 in this list


This is good stuff. I’m convinced.
This is US markets. Where do you go to find NH/NL on foreign exchanges?
pinnacledata.com has US markets and commodities.
Thanks for this follow up work Chris. Regards.
Just scanned your Mar 18 post.
http://www.chrisperruna.com/2013/03/18/identify-market-tops-and-bottoms-by-doing-this-guaranteed/
I am not seeing (maybe I’m missing it) when the NH-NL signal went negative in the 2007-9 mess.
By eyeballing it, it appears Nov 2007 or Jan 2008. When did your system triggered the “get out now” sell button?
Hi Chris, I am reading Dr Alexander Elder’s book on NHNL Index and I have copied your data (above) into an Excel spreadsheet to check his logic. His suggestion agrees 100% with yours – the NHNL Index accurately predicts the 1987 crash. You and he are completely correct – this crash could have been predicted. Congratulations.
I would like to check whether the index also suggests when to get back into the market using Dr Elder’s method. I wonder if you would be kind enough to email me the data for date, DJIA, New Highs, New Lows from the end of October 1987 until, say, 31 December 1988 so I can run a check? I would be happy to share the results with you but do not have access to this date – which you obviously have.
I would be grateful for your help.
Thanks,
Brett Morris
Australia