Archives for March 2006

STRL – Sterling Construction hits Retracements

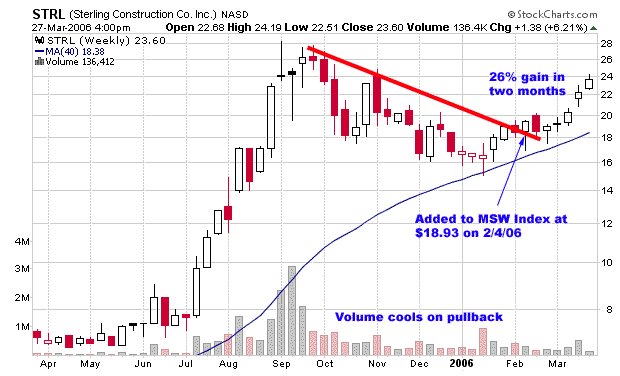
I started to cover Sterling Construction (STRL) on the MSW Index on February 4, 2006 at $18.93 as it gained support at the 200-d m.a. I purchased shares for myself at $19.05 the following week. The stock almost violated a mental sell stop but I held due to support below and have been rewarded with a 26% gain in less than two months. I wrote an extensive blog post here about price targets and retracement levels for STRL, including a chart.

In that post, I said:
“The first method to determine if the stock had bottomed is the use of the Fibonacci retracement levels (in this case, the 38.2% retracement which equals $15.46). It turns out that this retracement level also corresponds with the 200-d m.a. support and lifted the stock higher. Turning to the retracement level on the positive side, the method predicts a top at three common locations:
61.8%: $23.26
50.0%: $21.13
38.2%: $20.13”

Today’s close above the 61.8% retracement level on strong volume gives us a positive feeling about the stock. My target of $30 still exists for the year and my prior post explains where that number was derived.

Piranha

CB Richard Ellis Group, CBG, is an All-Star Stock

CB Richard Ellis Group, Inc. (CBG) was first screened on MSW on Thursday, May 19, 2005 at $37.22. We established a breakout and/or pivot point of $38.95 and declared a strong support level near $33.00. I instantly saw a company with great potential even though we weren’t talking about a new technology or juicy subject. The chart at the bottom of this blog post shows what I was looking at last summer as the stock started to make its run. Here is a link to a blog post I made in August 2005 after the stock was already up over 30% in 10 weeks:

CBG Blog – August 2005

The stock ran into resistance early last fall but we held tight since it wasn’t violating the 50-d m.a. with distribution days. For 13 weeks, the stock traded sideways before breaking out once again, above $50 per share. It hasn’t looked back and is trading at a new high once again today above $77 per share. The stock has made 40 consecutive weekly screens (now referred to as the MSW Index). If the stock continues to travel through the $60-$100 run, it will become a long term capital gain and those gains will be well over 100% in only twelve months without much risk along the way. Looking at the chart, we can see the slow steady growth since the original breakout in May 2005.

Keep one thing in mind: Don’t hold the position for tax implications if it suddenly started to fall. Sell immediately and take the profits because they should exceed the difference between short term and long term capital gains (if the stock tanks). If it trades sideways or better yet, continues to move higher, hold and don’t sell until we see the first set of red flag warnings.

Now I will compare the fundamental numbers I crunched in August 2005 and some new numbers I crunched earlier today:

***Note the difference in institutional supporters over the past 10 months (almost 400 new institutional holders which explains the 100% advance perfectly!***

Current Fundamental Numbers (3/24/06):
3-Year EPS Rate: 97%
3-Year Sales Rate: 40%
PEG Ratio: 1.17
ROE: 32%

Updated EPS Analysis:
2003: -0.34
2004: 0.91
2005: 2.84
2006: 3.60 (E)
2007: 4.17 (E)

Number of Institutions (last reporting period):
Total: 523
Money Mangers: 207
Mutual Funds: 296
Other: 20

August 2005 Fundamental Numbers:
3-Year EPS Rate: 65%
3-Year Sales Rate: 54%
PEG Ratio: 1.20
ROE: 22%

EPS Analysis:
2003: -0.23
2004: 1.65
2005: 2.24 (E)
2006: 2.39 (E)

Number of Institutions (last reporting period):
Total: 111
Money Mangers: 51
Mutual Funds: 56
Other: 4


Piranha

Southwestern Energy (SWN) a short?

Looking at a multi-year chart, you would not want to challenge the institutional support that Southwestern Energy Co. (SWN) has received for the past several years at the 200-d moving average. The stock has increasing quarterly and yearly earnings.

Yearly EPS:
2003: 0.37
2004: 0.70
2005: 0.94
2006: 1.23 (E)
2007: 1.56 (E)

Return on equity has been average when compared to its peers but not overwhelming. Revenues are rising and the debt-to-equity ratio is below the industry average. Above all else, it resides in an industry group that has been leading the market for the past two years while oil prices continue to increase and trade above $60 a barrel.

So why would I consider shorting the stock or buying several put options?
For starters, it violated the 200-d m.a. for the first time in almost three years.
It attempted to recover the moving average and failed, another event that hasn’t occurred in years.

The short position or put options can be placed (or bought) right now but I must warn that oil is still trading above it’s respective 200-d m.a. Unless oil cracks $60 and breaks below its own moving average, this play may not work out. If you initiate the position, make sure you use the correct position sizing techniques and protect yourself from a move to the up-side.

It’s ok to be wrong but its not ok to be wrong and sit without getting out of the position. If (SWN) fails to recover the 200-d m.a. once again, this will be a strong signal to place the position if you don’t do it before then.

Good luck, we’ll see what happens.
By the way, I am not bearish or bullish on the market, I am just searching for opportunities.


Piranha

Google Finance

When I woke up today and started to study several stock charts and then the statistics at my websites, I noticed a huge increase in traffic to my blog. I couldn’t believe the spike in traffic and the number of people that already visited my blog today (it was only 7am EST). I quickly checked the statistics and realized that the traffic was coming from a new source. I was amazed to see how many of my blog posts were placed number one or two on the new Google Finance page – blog section.

My posts about Hansen Natural (HANS) seemed to be the top supplier of new traffic. I took a look at Google Finance and it follows the format of the original Google and has several features that I already like better than yahoo finance.

I am already adding this site to my favorites and found an interesting article on Trader Mike’s page talking about Google Finance

Take a look and enjoy!

My typical daily screens will return tonight on MSW.
Piranha

Interesting Stock Market Links

As many of you know, I have been dealing with a death in the family so my research and analysis has been limited over the past week. Today’s blog post will contain some interesting stock links and information about a few MSW Index movers and shakers.

Movers today on the MSW Index:
BOT – up over 5% as we prepare to close trading for the day. The stock was up as high as $125 in intraday trading on above average volume.

STRL – up over 8% prior to the close today after Q4 earnings were released. Profits were up for the stock that has been trending above the moving average for several weeks.

NWRE – up almost 6% at 3:50pm as the stock challenges last week’s high

VIVO – up almost 8% as we set to close trading for the day. The stock moved on volume almost double the 50-d average.

On the downside:
TALX – down almost 8% as the stock was hit hard in heavy volume (looking to gain support at the 200-d m.a.) Remember what I said on the MSW Index; if it holds the 200-d m.a. as support, a trend buying opportunity exists. The stock has not violated the line since mid-2004.

A low priced stock to watch:
CAMP
– I listed the stock as a risky trend play on Saturday and said: “a risky low priced stock that is looking to pop with support at the 200-d m.a.” The stock jumped more than 4% today to close slightly below the 50-d m.a. The (recent) weekly chart looks very similar to STRL with support at the 200-d moving average

While I am grieving with the family tonight and tomorrow with viewings and the mass, I wanted to draw your attention to some other excellent stock market blogs, articles and posts:

Trader Mike: Stock Market Quick Links
Recent Stock Trading Related Links from Trader Mike (a great blog by the way).

Fickle Trader Blog
An excellent market blog from a market enthusiast with screens based on his proprietary market homework. I met Jon on the Richdad forms several years back.

Trend Following with CANSLIM
Jim, one of our own at MSW, using strategies from CANSLIM and long term trend following to obtain outstanding returns in stocks, commodities, and forex.

Has trading got tougher lately? Let’s find out…
By Brett Steenbarger at TradingMarkets.com (found through Trader Mike)

Money Management, Bet Sizing, Position Sizing All Mean the Same Thing
Money Management has many names: asset allocation, position sizing, bet size, portfolio heat, portfolio allocation or even risk control. It is terribly important for long term success. It is at the root of all trend following winners.

Trader Mike on Position Sizing
Position sizing could very well be the most important aspect of a trading system, yet, like expectancy, it’s rarely covered in trading books.

Falkin Investing Organization
The FIO is a 501c status pending non profit organization dedicated to the stock market. Established in December 2005, the Organization was created as a way to connect traders of all experience levels across the globe without the spamming, bashing, or just an overwhelming presence of, “must buy products”. I have gotten to know the president (slightly through e-mail), Blain Reinkensmeyer, over the past several months. He is a young, ambitious, entrepreneurial-minded person with a bright future following his passions. Good luck with the new website!

Enjoy,
Chris