New High New Low Data (NH-NL) Warns of 1987 Crash

I received a comment questioning if the 1987 Market Crash was detected by the NH-NL data following my blog post titled Nail Market Tops and Bottoms by Doing this, Guaranteed!.

When viewing the NH-NL data, much of the first half of 1987 was stable. Readings were mostly positive with a few bouts of light pink (negative readings) in April and May. Although there was some negativity in the NH-NL readings, the 30-d Differential (Diff) did not turn negative in April 1987. It did however turn negative for seven consecutive days in May 1987. The number of days with 100+ New Lows for the year up until the end of May was two (one on April 14, 1987 and one on May 20, 1987, 112 and 109 NL’s respectively).

July 1987 NH-NL Readings for NYSE:
1987_07 - July

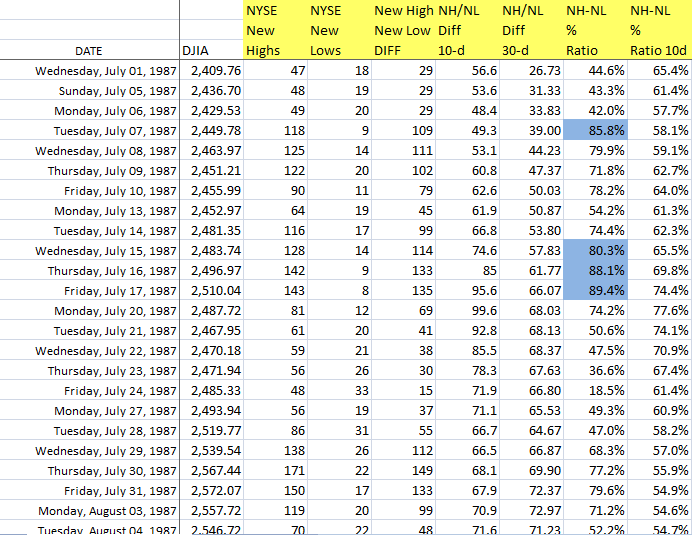
By June, the readings were back to the positive side, averaging a +70 Differential for the summer (June, July and August) with the only negative daily reading coming on June 2, 1987 at 21 NH’s and 28 NL’s or a negative 7 Differential. The next negative day did not occur until September 2, 1987 with a 24-31 reading or negative 7 Differential.

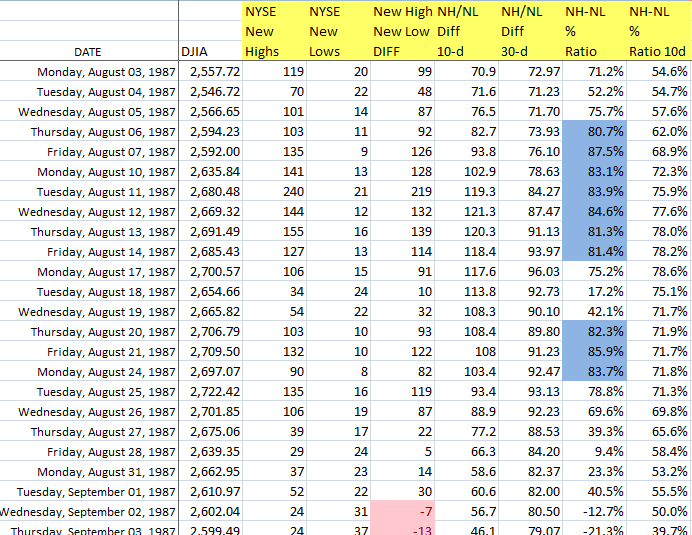
August 1987 NH-NL Readings for NYSE:
1987_08 - August

Prior to dissecting the NH-NL data, I must iterate that all SEASONED investors should know that they must follow PRICE and VOLUME first and that the DJIA was flashing distribution days throughout the month of September. The NH-NL red flags only back-up the story that price and volume is telling (the NH-NL confirms what the market is doing). In addition to the DJIA showing multiple distribution days, the index closed below its 50-d MA in September. It attempted to cross back above the moving average late in the month but quickly crashed back below it in early October, prior to the crash.

DJIA 1987 – Distribution & NH-NL Red Flags:
2013_03-26_DJIA_1987_Crash

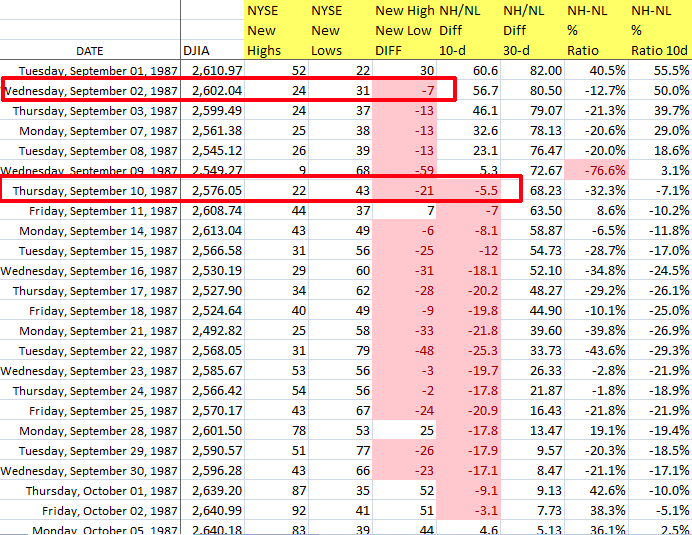
The first big NH-NL clue signaling weakness came in September 1987. For the month, 18 of the 21 trading days recorded a negative Differential reading (the month averaged a negative 15 Diff, marking the weakest month of readings since July 1984 when every day was negative).

September 1987 NH-NL Readings for NYSE:
1987_09 - September

The average daily Differential reading for the first 8 months of the year, through August 31, 1987 was +69.9. As mentioned, the average Diff reading in September 1987 was -15. By contrast, the average reading for October turned out to be a whopping negative 226. The average reading from October 1st through October 16th was negative 70, a complete 180 from the first 8 months.

Below are the key dates that pop out waiving red flags for the longer term trader:

  • On September 2, 1987: The NH-NL Differential (Diff) goes red
  • On September 10, 1987: The 10d Average Diff goes red
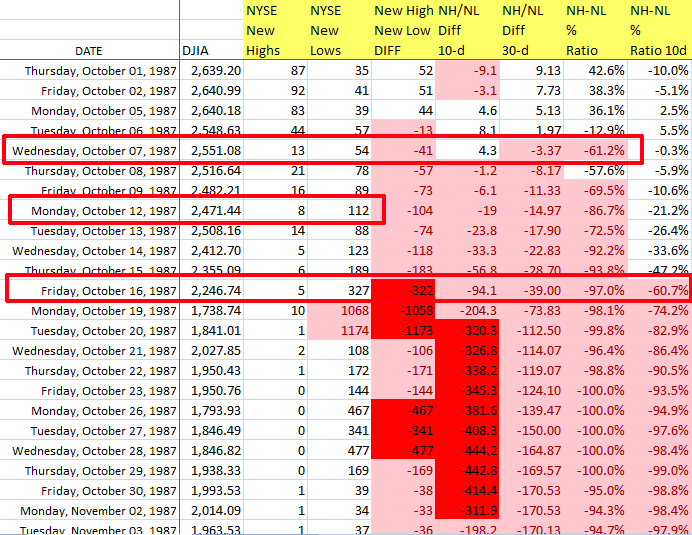
  • On October 7, 1987: The 30d diff goes red
  • On October 12, 1987: The 1st 100+ New Low (NL) day is recorded
  • On October 16, 1987: The NH-NL Diff goes DARK RED which means more than 300+ NL’s

The October 16, 1987 NH-NL reading of 5-327 or a negative 322 was the weakest NL reading since Monday, September 28, 1981 when 590 NL’s were recorded (with only 1 new high).

This was a MAJOR RED FLAG – but was it too late because data is recorded “end of day”?

We all know what happened the following Monday – markets crashed and NH-NL reading settled in at 10 NH’s and 1,068 NL’s for a -1,058 Diff. Tuesday, October 20, 1987 was even worse as the Diff closed at 1 NH’s and 1,174 NL’s for a Diff reading of -1,173.

October 1987 NH-NL Readings for NYSE:
1987_10 - October

[Read more…]

Trend Reversal Watch

I am on a trend reversal watch in equities and major indices alike. I am specifically looking for the classic 1-2-3 setup or as mentioned last week, a Dow Theory confirmation of a trend change.

I am watching the major indices for a reversal pattern setup. For example, the NASDAQ and DOW have both violated their long term trends but they are yet to establish a definite “minor low” and then a failure to close above the previous high.

Let’s see if the NASDAQ and DOW will continue to form a chart similar to BLK.

052310_BLK_wkly

Do not jump the guy and start shorting before the SIGNAL is given. Be patient, these patterns can take months to confirm.

We are looking for point #2 and point #3 to confirm before establishing a short (trend reversal position).

Point #1 has confirmed but that is not enough to place a short position, the risk is still high as the odds have not been confirmed in our favor. Without confirmation, the market could move higher which will lead to unnecessary losses.

052310_COMPQ_wkly

052310_INDU_wkly

Back to Victor Sperandeo’s book about the 1-2-3 setup:

At the point where all three of these events have occurred graphically, there exists the equivalent of a Dow Theory confirmation of a trend change. Either of the first two conditions alone is evidence of a probable change in trend. Two out of three increases the probability of a change in trend. And three out of three defines a change in trend.

Three out of three defines a change in trend : that is what I am looking for. At that point (if it happens) is when I will short and short heavily!

Lastly, keep in mind that this 1-2-3 pattern also works for reversal to the up-side:

052310_QID_wkly

Home Builders Update

The builder’s index was up more than 10% this week (July 20-24, 2009), one of the leading groups in the market. The industry is still badly beaten and I do not own shares in any of the companies listed and I don’t plan to buy any time soon. Like I said two years ago in the blog post The Best Home Builder Stock

“The bottom may be near but the upswing could take years if you go back and research history. Badly beaten down industries can take anywhere from two to five years to rebound and start trading higher.”

Give it time, past industries can and usually do take years to recover. The one “prediction” I did make has held true, NVR continues to be the group’s leader. Since my blog post on 8/24/07, NVR is the ONLY stock showing a gain with Hovnanian still down more than 75%. Toll Brothers is a distant second with a 10.77% loss.

072509_nvr_monthly_01

(NVR) NVR Inc.: + 7.74%
(TOL) Toll Brothers Inc.: -10.77%
(MDC) MDC Holdings Inc.: -19.99%
(DHI) DR Horton Inc.: -22.76%
(RYL) Ryland Group Inc.: -30.15%
(PHM) Pulte Homes Inc.: -40.29%
(KBH) KB Home: -43.33%
(LEN) Lennar Corp.: -58.49%
(CTX) Centex Corporation: -67.11%
(BZH) Beazer Homes USA Inc.: -75.27%
(HOV) Hovnanian Enterprises Inc.: -75.99%

I guess it helped to work in this industry during the boom for approximately five years but I am sill surprised that some of the big guys haven’t merged or taken over their competitors.

Other than Housing, Biotech and Cyclicals also lead the market this past week (+26% & +10% respectively), these are not the groups of choice for leaders (in my opinion).

072509_nvr_monthly_02

Here’s the original post from August 24, 2007:

The analysis below will show you why I select this stock as the best bet when the builders eventually hit a bottom and start moving higher.

Nathan Rothschild, founder of one of Europe’s most-powerful economic dynasties, uttered one of the most frequently quoted maxims on investment timing in the early 19th Century when he said, “The best time to buy is when blood is running in the streets.”

Now, blood is running in the streets for this industry and the homebuilders are getting their rear-ends kicked by Wall Street, the media and anyone else that will jump on the bandwagon.

082407_list_builders.png

So, when will the bottom arrive? Who the hell knows? And if someone tells you they know, just walk away because they are fooling themselves and anyone who listens.

The bottom may be near but the upswing could take years if you go back and research history. Badly beaten down industries can take anywhere from two to five years to rebound and start trading higher.

With that said, I would like to tell you why I feel that NVR Homes (NVR) is the best bet when the bottom does arrive and we start to see some life in this area.

[Read more…]

My Twitter Positions are Up Big

I have been using Twitter and StockTwits for approximately two months and have highlighted 18 different stocks. Of the 18 stocks, 15 are currently showing a gain and 3 are showing a loss for an average gain of 20% per position. I only analyze stocks that I am about to buy/sell or would possibly buy/sell. I don’t talk about any old stock for the sake of posting tweets and wasting people’s time.

The average gain of the stocks showing a profit is 26%.
The average loss of the stocks showing a loss is 11% (-5%, -8% and -21%).

The top performing position is DXO, currently up 65% with a peak gain above 70%. Following DXO is EJ at 56%, STAR at 50%, RVBD at 40%, FRPT at 32%, ARST at 26% and V & VMW tied at 25%.

Visa (V) has appeared the most with a total of eight mentions (I may be biased since it’s my largest personal holding). DXO has also been an active play of mine since 2008 so it has been the second most popular ticker in my tweets, appearing five times over the past two months (DXO first appeared on this blog last November as a speculative oil play).

I would like to emphasize that the stock down 21% (APEI) would have been cut for a smaller loss using simple money management tools but for purposes of this update, we’ll assume everything is still being held.

Below is the list of stocks highlighted on my Twitter account, listed in date order (starting on March 31, 2009):

  • HTS: +7%, $26.15 from $24.35 on 3/31/09
  • V: +25%, $69.28 from $55.60 on 3/31/09
  • VMW: +25%, 32.59 from $26.12 on 4/1/09
  • RVBD: +40%, $21.52 from $15.37 on 4/2/09
  • STAR: +50%, $22.45 from $15.00 on 4/5/09
  • CXO: +14%, $31.90 from $27.96 on 4/5/09
  • DXO: +65%, $4.48 from $2.72 on 4/20/09 (1st posted on 4/6/09 at $3.07)
  • EJ: +56%, $16.78 from $10.79 on 4/9/08
  • ARST: +26%, $18.19 from $14.46 on 4/9/09
  • FRPT: +32%, $9.36 from $7.09 on 4/13/09
  • WMZ: +12%, $19.85 from $17.70 on 4/14/09
  • CTCT: +10%, $20.14 from $18.36 on 4/20/09
  • TNDM: +15%, $30.78 from $26.81 on 4/20/09
  • CFL: +11%, $30.60 from $27.50 on 4/26/09
  • PAR: +3%, $11.27 from $10.94 on 6/2/09
  • APEI: -21%, $34.56 from $44.00 on 4/2/09
  • MDAS: -5%, $15.90 from $16.79 on 4/23/09
  • MELI: -8%, $23.62 from $25.60 on 5/12/09

If you haven’t joined already, take the few seconds to follow me on Twitter as the bulk of my analysis appears there weekly, if not nightly.

P.S. – the bragging title of this post probably signals a short term top in the market! As I wrote yesterday:

“The main purpose of the stock market is to make fools of as many men as possible.” – Bernard Baruch

060609_dxo_daily

060609_v_daily

060609_ej_daily

[Read more…]

Last Chance for Summer Reading

My final summer trip is coming up (the big one to Europe) so I will be bringing along two books (I hope the dog and his house sitter get along; by the way, Continental quoted us $1,800 one way to fly our 100lb lab to Europe):

The first has to do with real estate, something I have been focusing on over the past several months; the Nickerson book is a RE classic from the 1950’s & 60’s (don’t even think “get-rich-quick – can’t stand those). The second is a fiction classic that I have never read and have always wanted to. Or, you could always stick to the stock market books listed below; I have read them all!

*
*

Learning about Stocks (Fundamental and Technical Principles):

System Development and Market Psychology:

Great All-around Reads:

All Others: