“I hear and I forget. I see and I remember. I do and I understand.” – Confucius
I placed a UWTI trade because I wanted to understand the decay first hand. Of course I could have done a mock-trade, a paper-trade or any other applicable simulation but would I fully understand the implications?
Of course I would but it always sinks in better (with me at least), when “I do it”.
Experiences last in your memory and experts say they influence future behavior. I may be able to argue that I wanted to “experience” the decay first hand so I would avoid these garbage products in the future and stick to products with less decay and daily expenses. I wanted to overcome my allure to the “3x” aspect of these products.
Here’s my trade:
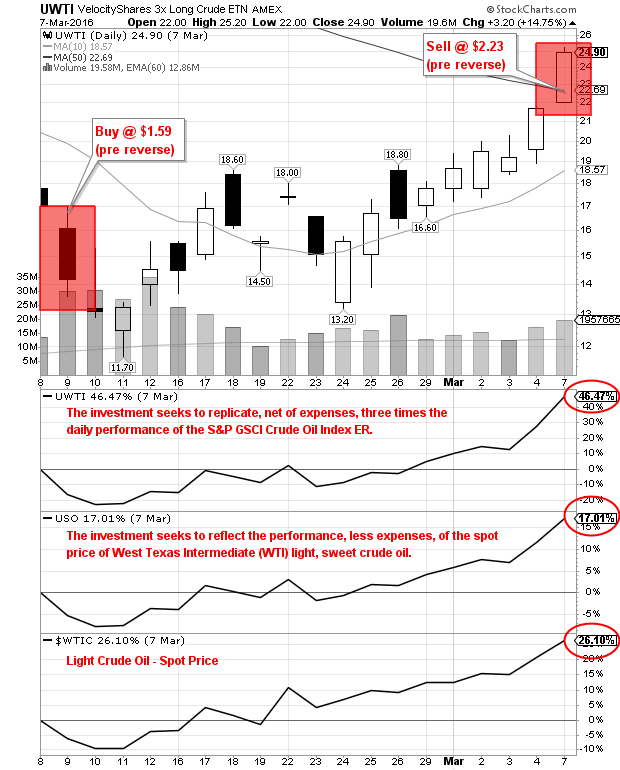
Buy $UWTI 2/9/16 at $1.59
Sell $UWTI 3/7/16 at $2.23
+ 40.2%
What’s wrong with a 40% gain? Nothing, I’ll take that gain over any 4 week period but in this particular case, the product did not provide a 3x return so I was robbed. A true 3x gain would have been closer to 80% but I knew, full well, going into the trade that substantial decay would occur if I held more than one or two days.
What is UWTI (VelocityShares 3x Long Crude Oil ETN):
The investment seeks to replicate, net of expenses, three times the daily performance of the S&P GSCI Crude Oil Index ER. The index comprises futures contracts on a single commodity and is calculated according to the methodology of the S&P GSCI Index. – Yahoo Finance.
As a comparison:
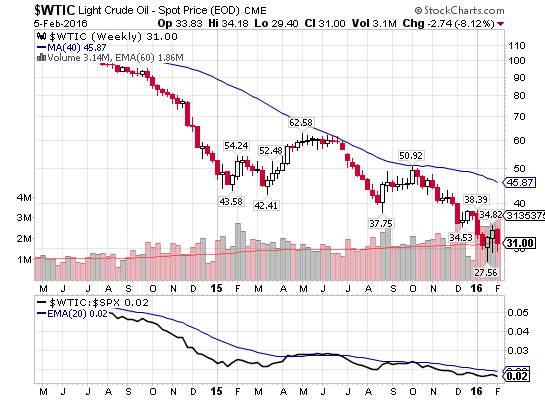
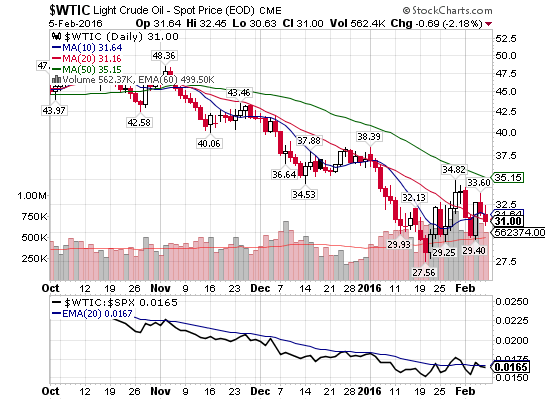
$WTIC was up 26.10%
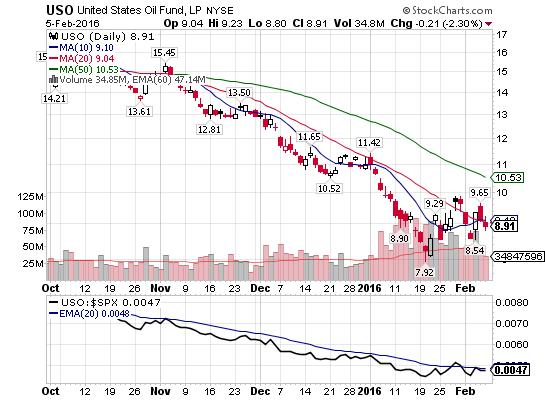
$USO was up 17.01%
These results occurred during the same period (NOTE: WTIC was up 46.47% during this period as my entry and exit was not the exact open and close on 2/9 and 3/7).


Connect with Me