Archives for October 2006

YTD Performances

In the charts below, I have grouped together the performance in 2006 of the three main indexes, major world currencies, commodities, specific industries and some sector spdrs in the charts below. I have always found it interesting and sometimes useful to watch the performance of major market indexes, sectors and industries. Charts like these can serve as macro views of the general market but don’t ever use these types of charts to pinpoint potential market tops and bottoms. I use them to help confirm action among the individual stocks that I am looking to buy or sell. Secondary indicators is all they are in my opinion.
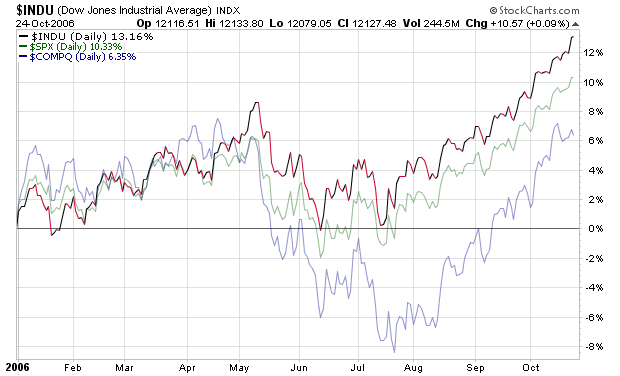
Major Indexes:
$INDU – Dow Jones Indu., 13.16%
$SPX – S&P 500, 10.33%
$COMPQ – NASDAQ, 6.35%

Commodities:
$GYX – GSCI Industrial Metals, 57.87%
$GPX – GSCI Precious Metals, 14.35%
$GOLD – Gold, 12.74%
$WTIC – Crude Oil, -3.65%
$GJX – GSCI Energy, -8.06%

Currencies
$XBP – British Pound, 8.97%
$XEU – Euro, 6.09%
$XSF – Swiss Franc, 3.88%
$XJY – Japaneese Yen, -1.82%
$USD – US Dollar, -4.85%
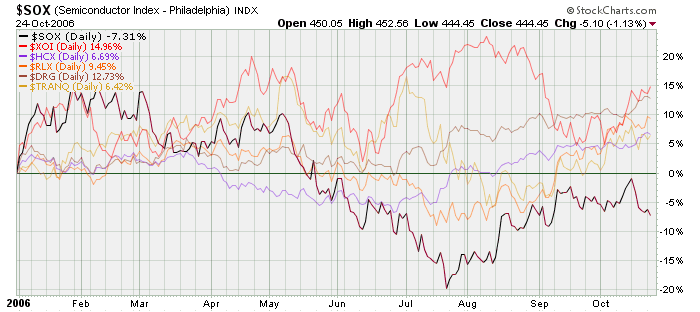
US Industries
$XOI – Oil, 14.96%
$DRG – Drugs, 12.73%
$RLX – Retailers, 9.45%
$HCX – Health Care, 6.69%
$TRANQ – Transport, 6.42%
$SOX – Semiconductors, -7.31%

Select Sector SPDRs
XLU – Utilities, 16.25%
XLF – Financial, 13.39%
XLB – Materials, 11.77%
XLI – Industrial, 10.97%
XLK – Technology, 9.12%
XLV – Health Care, 7.66%

Piranha

Strongest NH-NL Ratio Reading in Months

The NH-NL ratio surpassed its strongest weekly level since May 6, 2006 when it closed at 503-74. This was the tenth consecutive positive weekly ratio with new highs closing at 442 and new lows dropping below 30 for the first time in 2006. The weekly lows averaged 29 per day which gives us the lowest reading since the week ending July 30, 2005 when the market averaged exactly 28 new lows per day. The NH-NL ratio chart shows that last week gave us the highest reading (87.69%) since the week ending January 14, 2006 (87.97%). The past two weeks have spent time above the positive 80% calculation that I have explained on past blog entries (links below). The NH-NL ratio has gained strength for the past 10 weeks according to the number of new highs versus the number of new lows and is looking like a similar pattern to 2005.

Monday had a total of 636 new highs, the most new highs in one day since Monday, May 5, 2006 when the daily ratio closed at 745-38. The ratio continues to gain strength and individual leaders are moving higher (stocks on our MSW Index and the IBD 100) but many secondary indicators are suggesting that the market is still extended. The main secondary indicator that I follow is the number of stocks trading above their 50-day moving average on the S&P 500. It closed at 80.80% after reaching an intra-week high of 85.20%, the highest reading since the January 2006. The market didn’t peak for another four months after reaching the level above 80% in January and this is why the indicator remains secondary. When the NASDAQ finally turned, the percentage of stocks above their 50d- m.a. was closer to 65% in early May (it dropped below 50% the following week while the market took a plunge).

To calculate the percentage correctly, use this formula:
(New Highs – New Lows) / (New Highs + New Lows) * 100 = X%

Where do the Major Indexes stand in 2006?
NASDAQ: +6.21%
DOW: +11.99%
NYSE: +12.23%
S&P 500: +9.64%

Below is an updated look at the weekly averages for the NH-NL Ratio:
Saturday, January 14, 2006: 500-32
Saturday, January 21, 2006: 348-46
Saturday, January 28, 2006: 516-46
Saturday, February 4, 2006: 449-44
Saturday, February 11, 2006: 229-57
Saturday, February 18, 2006: 306-42
Saturday, February 25, 2006: 420-36
Saturday, March 04, 2006: 399-49
Saturday, March 11, 2006: 162-84
Saturday, March 18, 2006: 459-53
Saturday, March 25, 2006: 312-52
Saturday, April 01, 2006: 441-39
Saturday, April 08, 2006: 481-58
Saturday, April 15, 2006: 150-103
Saturday, April 22, 2006: 540-75
Saturday, April 29, 2006: 353-76
Saturday, May 6, 2006: 503-74
Saturday, May 13, 2006: 384-116
Saturday, May 20, 2006: 64-211
Saturday, May 27, 2006: 57-182
Saturday, June 3, 2006: 119-93
Saturday, June 10, 2006: 72-204
Saturday, June 17, 2006: 41-310
Saturday, June 24, 2006: 56-238
Saturday, July 01, 2006: 127-198
Saturday, July 08, 2006: 143-95
Saturday, July 15, 2006: 74-273
Saturday, July 22, 2006: 66 – 307
Saturday, July 29, 2006: 163-151
Saturday, August 5, 2006: 194-132
Saturday, August 12, 2006: 88-210
Saturday, August 19, 2006: 178-96
Saturday, August 26, 2006: 140-74
Saturday, September 2, 2006: 285-42
Saturday, September 9, 2006: 143-60
Saturday, September 16, 2006: 244-75
Saturday, September 23, 2006: 206-83
Saturday, September 30, 2006: 251-75
Saturday, October 7, 2006: 301-92
Saturday, October 14, 2006: 412-40
Saturday, October 21, 2006: 442-29 – This Week

Tuesday, September 19, 2006
NH-NL Ratio still Neutral

Monday, September 04, 2006
Looking at the Market through the NH-NL Ratio

Monday, August 14, 2006
New Highs and New lows telling a Story

Piranha

Comeback Kids?

Due to last night’s loss by the Mets, I am going to call today’s screen the comeback kids. I am disappointed today as a baseball fan but I will get over it and look forward to next season with a young group of comeback kids (I also have my Giants playing the Cowboys this Monday night).

Are the stocks below a bunch of comeback kids?

Many of them are only a few years old and are gathering some support near their 200-d m.a. as the market looks to be forming its first pull-back or high handle. The market is overbought and extended so I am cautious with this type of a screen but it is important to look for stocks that can gain support above their 200-d moving average.

Many of these stocks are recovering or gaining price strength above their 200-d moving averages but their volume is not cooperating on the weekly chart which does raise a red flag. The stocks screened are ones that made positive gains yesterday, have respectable relative strength ratings and earnings ratings greater than 70% of their peers. Keep in mind that I may have left some solid candidates off of the list because the screen was only looking for stocks making gains during the day Thursday. All prices quoted are from the end of day Thursday.

Comeback Kids?

  • STLD – 58.69, nice support along the 200-d m.a. with increases in volume. The next short term buy is a move above $60
  • DRQ – 37.84, back above the 200-d m.a. as the stock is gaining some support with increased volume on the daily chart
  • FTI – 60.25, this chart is very similar to the first two stocks listed today as the 200-d m.a. recovery is underway but weekly volume is not above average
  • BRG – 65.84, after five months of consolidation back to the 200-d m.a., the stock is moving higher on increased volume. Could be a $60-$100 setup
  • GPI – 50.16, the stock corrected about 30% from its high and is now trending back above its long term moving average. Short term buy is a move above $52
  • BUCY – 49.40, the recent and former MSW Index stock is back above the 200-d m.a. but volume is lower than the distribution weeks.
  • ANDE – 38.30, the stock has corrected by 50% since its high above $62 and is now gaining support along the 200-d m.a. with a possible deep cup pattern forming
  • EXPD – 48.11, another one of those young growth stocks that corrected to the 200-d m.a. after a nice run and is now trending higher. The trend buy is along the moving averages
  • VMC – 84.20, building a five month cup shaped pattern with recent support at and above the 200-d m.a. Volume has been light so be skeptical.
  • AEM – 33.25, riding the 200-d m.a. with a short term entry on a move above $34. Once again, I would like to see volume increases to confirm the move
  • NTG – 32.72, the stock fell below the 200-d m.a. for the first time in years but is fighting to get back above (volume has been light)
  • OXPS – 30.19, the former MSW Index stock is back above both moving averages and is gaining volume strength on the daily chart but not the weekly chart.
    DB – 123.58, a cup with handle base above the 200-d m.a. with a pivot point of $125.42
  • MDR – 44.36, a long time superstar that has been riding above the 200-d m.a. for the past couple of years with its first challenge of support in September. The stock caught support and is looking to recover its 50-d m.a. but daily volume is low. I would wait for a new 52-week high before becoming interested.
  • DAKT – 22.42, the stock took a hard fall in August back down to the 200-d m.a. but has since caught its footing. The trend buy would be now with proper sell stops in place
  • TTI – 25.95, the stock has consolidated through out 2006 with recent support near the 200-d m.a. and is now attempting to stay above the long term average. Volume has dried up, so watch the RS line carefully
  • HSC – 82.20, a strong stock from 2005, Harsco has consolidated in 2006 and is looking to gain some strength here above the 200-d m.a.
  • ADM – 37.90, a great stock from late 2005 until mid-2006 with a recent correction back to the 200-d m.a. It seems to be getting some support at the long term support line but must recover back above the 50-d m.a.
  • TS – 37.71, one of the top performing stocks on the MSW Index in 2005 and early 2006 but was recently removed due to lack of strength and a declining RS line. It has since recovered the 200-d m.a. and will stay on my radar.

Piranha

Let’s GO Mets GO!


Game 6 was awesome (almost as good as game 7 of 1986, I was there) – now we need a big win in game 7 of the NLCS!

LET’S GO METS!


Piranha

Is BOT the Next CME? – March 1, 2006

I wrote a blog post one week ago today reviewing the CBOT case study I did back in March 2006 which was originally titled:

Is BOT the next CME

After today, BOT is now part of the Chicago Mercantile Exchange Holdings Inc. (CME)!

The world’s biggest financial exchange announced on Tuesday it would acquire rival CBOT Holdings, Inc. (BOT) for more than $8 billion in a deal that would combine the two largest U.S. futures exchanges.

It’s funny and ironic that I also just posted up a thread on Tuesday, October 10, 2006 titled: Exchange Stocks: ISE w/ ICE & BOT

When your hot, your HOT!

Piranha

p.s. – This could be a great story over at WallStrip – What do you think guys and gals?