A Blackberry Pearl from RIMM

Making a Christmas List: Part V

A blackberry Pearl from Research in Motion (RIMM) is an excellent gift for anyone that wants to have their e-mail, calendar, contacts and more on the go. I mentioned that Apple is a great company but the Blackberry is all anyone carries in NYC (because it works so well with Microsoft and unfortunately, that is what everyone uses). If I had to guess, I would say that 7 out of 10 professionals carry some form of a Blackberry in the tri-state area (if not more).

Below is the case study I did for RIMM on April 8, 2004 when the stock was trading at $104.21 per share (now a split-adjusted $17.58). RIMM closed at $122.08 for a 594% gain in 3.5 years (if you or I was a holder the entire time).

I started coverage of RIMM during a “Piranha’s Weekly Market Watch” on January 11, 2004 at $76.25 or a split adjusted price of $12.71 (an 860% gain).

Of all the research I did for MarketStockWatch.com (while it was open prior to chrisperruna.com), my analysis of the start of the bull market has been my most proud accomplishment (and a piece of it can be read within the RIMM case study as well).

Chart of RIMM in 2004 (originally posted on MarketStockWatch.com):

112907_rimm_2004.png

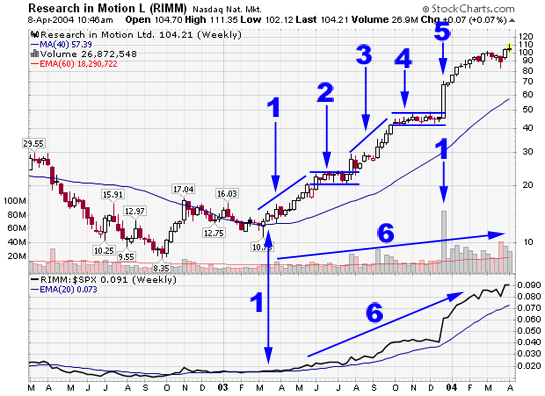
CASE STUDY – FLAT BASE on top of FLAT BASE
RIMM – Research in Motion Ltd.
Industry - Telecom-Wireless Equip

Piranha’s Weekly Market Watch – listed on 1/11/04 at $76.25
RIMM peaked yesterday at $111.35, a 46% gain in 3 months

Chart Legend:
1. The general market (DOW and NASDAQ) had a follow-through day and shows the first signs of a possible new bull market (March 2003). RIMM makes solid gains above the 50-day on the largest volume in almost 5 months. 50-day MA is starting to flatten from recent down trend. RIMM begins its first up-trend during the new hot market.
2. RIMM consolidates into a 7-week flat base (the min. number of weeks required to qualify for a flat base).
3. RIMM breakout of the flat base on the largest volume of the year. The second leg of this run is now underway.
4. RIMM decided to consolidate for a second time and forms another flat base, this one lasting 11 weeks – notice how the volume dropped during the building of this base – a very positive sign.
5. RIMM breaks-out on the largest volume EVER. Stock is up 50% this week on the second consecutive positive earnings report. (Posted on Piranha’s Weekly Screens soon after this powerful breakout).
6. Notice how the relative strength and volume have increasing during the entire run of the past 12 months – very positive.

RIMM is currently showing some sideways action but is among some top leaders over the past 12 months – MBT and VIP.

I hope you enjoyed the case study.

So, how do I feel about RIMM today? The same way I do about all the stocks on my Christmas list: I should have bought and held during the bull market. The earnings are fantastic! Analysts revised their guidance for 2007 and the company still shattered the number (by 192%).

112907_rimm_crossover.png

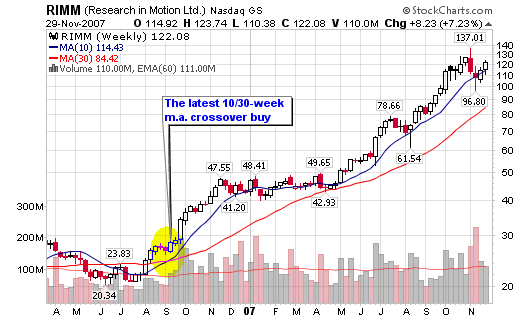
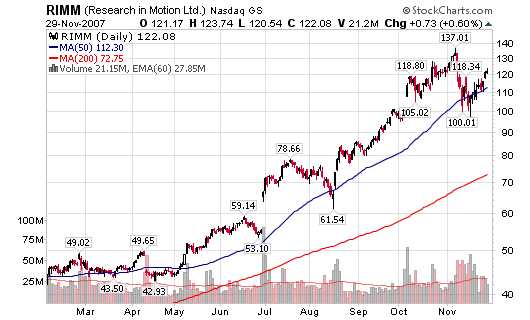
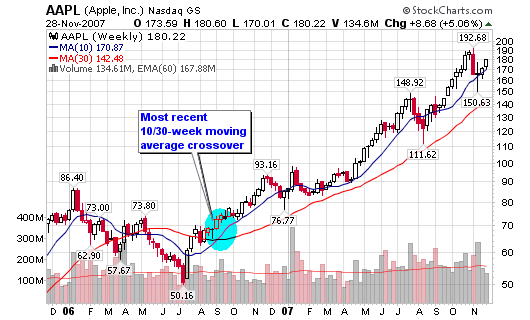
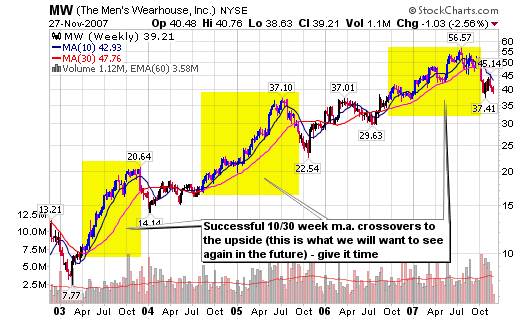
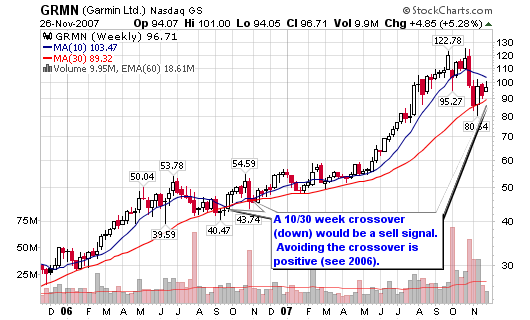
The stock is currently trading at the 50-day moving average for the third time this year, a line of support it has held since May 2007. Longer term, the stock is still in a very bullish up-trend that confirmed in September 2006 after the 10-week moving average crossed above the 30-week moving average.

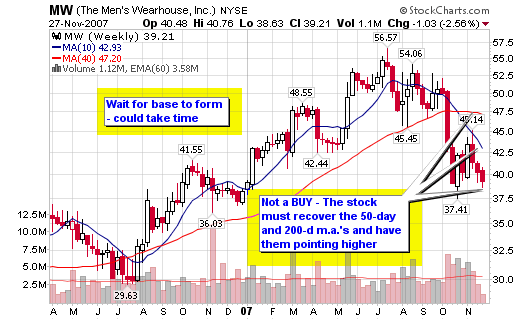
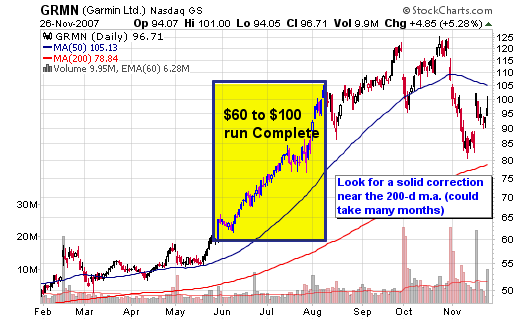
I don’t own shares of RIMM at this time but it’s not a bad area (right now) to establish a position with a tight stop as we flirt with all-time highs. Ideally, I would like to accumulate shares near the 200-d moving average but the stock is currently trading about 40 points higher than that area.

Earnings:
FY 2005: $0.70
FY 2006: $0.84
FY 2007: $1.11 (beat estimates by 192%)
FY 2008: $2.17E (looking for a 95% jump next year)
FY 2009: $3.26E

ROE: 33.82%
ROA: 26.94%
P/E Ratio: 79.39
PEG Ratio: 2.18

112907_rimm_daily.png

An iPod touch from Apple (AAPL)

Making a Christmas List IV

Music, videos, photos and websites in 8GB and 16GB models starting at $299.

How could you go wrong? I want an iPod touch from Apple almost as bad as I wish I held the shares I once owned. I have actually owned shares in Apple several times including the present but have always sold during down turns (so much for timing the market with this superstar). Superstar is an understatement with this stock.

Of all the possible gifts on my list, the latest iPod touch rises to the top due to the affordability, the usability and the “cool” factor.

I do have one reservation: Why can’t a company such as Apple (AAPL) create a screen that will be easy on my eyes and allow me to transfer my subscription of Investor’s Business Daily (e-IBD) in PDF format so I can read it anywhere at any time?

Can someone please invent a portable PDF reader that is easy on the eyes (Amazon has a solid product but it does not allow the transfer of PDF documents). If anyone can do it, Apple will and they will do it right. This is why the company and the stock have been one of the great stories of this bull market.

Stock Analysis:
Words can’t describe what this first chart shows us!

112807_aapl_monthly.png

The second chart shows us that Apple successfully made a 10/30 week crossover to the upside in September 2006 above $70 per share, a 157% gain to date. The 50-day moving average has been the most recent support level but I would still use the 200-day moving average as the ultimate test of time. A new high and a move above $200 per share will be very bullish and a signal that this stock may have another run regardless of what the major indices do.

112807_aapl_1030.png

Rating: Hold (accumulate on dips) – trend is still higher.

Earnings:
FY 2005: $1.44
FY 2006: $2.27
FY 2007: $3.93
FY 2008: $5.00E (27.23% increase)
FY 2009: $6.23E

ROE: 28.52%
ROA: 16.43%
P/E Ratio: 44.46
PEG Ratio: 1.97

Institutional Analysis:
Total Institutions: 2,545
Money Market: 1,006
Mutual Fund: 1,459
Other: 80

Shares Held: 880.5 mil
Shares Held Previous Period: 849.6 mil

Shares Bought: 125.68 mil
Shares Sold: 94.78 mil
Value of Shares Bought: $19.2 Bil
Value of Shares Sold: $14.5 Bil

Prior coverage of Apple (AAPL) on the blog (stock screens not included):

1/17/07: All-Star Stock – Digesting Apple

Apple has been on my screens for 15 months and has been in my portfolio on two separate occasions over those 15 months. The most recent purchase was last summer as it broke into the $40 range. The first screen Apple made on MSW was on 10/24/04 at $23.71 (split adjusted from $47.41 – my actual entry area).

Since adding the stock back to the screens in July, Apple has gained over 100% and has moved up into the $60-$100 range. Overall, a long term holder from my initial coverage in October of 2004 would have a gain of 260%+. Two weeks ago, I said this to the community: “trend buyers could add shares now”. If they did, they are now up an additional 12% from the latest breakout point.

1/10/07: Apple Inc. is Still Green

What can I say; the apples keep getting greener! Apple Inc (the new name) unveiled its new iPhone and AppleTV yesterday as the stock was up over 8%.

1/13/05: Green “APPLE”s

Apple (AAPL) first showed up on my weekly screens on 10/24/04 at $47.41 (split adjusted 23.71). Since this time, Apple has made the daily and weekly screens numerous times.

The lesson of this blog is to pay attention to the charts, not the news. The charts showed us a buy 10 week ago and confirmed this buy several times since late October. Many people went out and bought Apple today based on the great news from yesterday (Apple shattered estimates).

10/25/04 - 10/29/04: $52.40

11/22/04 - 11/26/04: $64.55

11/29/04 - 12/03/04: $62.68

12/06/04 - 12/10/04: $65.15

01/03/05 - 01/07/05: $69.25

The most recent daily post was on 01/05/05 at $64.50.

Christmas List Series:

Next up in this 5-part Series:

  • Part V: A Blackberry Pearl from Research in Motion (RIMM), using the Verizon Wireless (VZ) Network

Suit Time at the Men’s Warehouse (MW)

Making a Christmas List – Part III

“You’re going to like the way you look” and “We guarantee it” – the trade mark quotes voiced by the Men’s Warehouse (MW) Founder and CEO, George Zimmer.

Who hasn’t watched one of those commercials?

Well, they worked on me because I own several suits from the Men’s Warehouse and will go back based on the quality service of their staff. I never feel pressured and always walk out with more than I anticipated (that’s a good store). I recently purchased two high quality brand name suits and a brand name overcoat for $1,000. I don’t think I could have found a better deal anywhere else. I (possibly) could have spent less at a SYMS store but not any of the major retailers (even with sales), never with an actual tailor or the local mom and pop shops. Forget about Manhattan!

You walk in, select the styles you like, try them on, get them measured by an in-house tailor and you will have your suits in no time (a couple days at most). I’m sold. However, the company and the stock are usually two different stories.

So, what does the stock look like?

112707_mw_5yr.png

I’ll start by saying that I made the same mistake with the Men’s Warehouse as I did with Toyota (TM) (my Lexus). I should have bought several thousand dollars worth of the Men’s Warehouse back in 2003 when it was trading as low as $7.77 (below $10 for the sake of this post).

It went on to gain 628% over the past five years with a 33-fold gain from base to peak since the IPO in the early 1990’s.

Now is not the time to buy the stock as it is currently trading below the 50-day average and the 200-day moving average. The 10-week moving average has also crossed below the 30-week moving average which signals a sell (not a buy in this case).

MW has violated the above mentioned moving averages in the past and has recovered after building a base for several months. The correction in late 2005 and early 2006 took more than a year before new highs were reached. This is a stock that needs to be treated with patience as we don’t need to jump the gun and enter prematurely. The stock reaped the rewards of the bull run from 2003 to 2007 so now will be the test to see if the Men’s Warehouse can and will remain a consistent money maker heading into 2008 and beyond.

112707_mw_weekly.png

Let’s look at the earnings, valuations and institutional numbers.

Earnings Watch:
FY 2005: $1.31
FY 2006: $2.04
FY 2007: $2.62
FY 2008: $2.98E (a 13.74% increase over 2007)
FY 2009: $3.41E

ROE: 23.79%
ROA: 15.28%
P/E Ratio: 11.85x
PEG Ratio: 0.79

Institutional Analysis:
Total Institutions: 700
Money Market: 233
Mutual Fund: 448
Other: 19

Shares Held: 78.88 mil
Shares Held Previous Period: 73.39 mil

Shares Bought: 16.41 mil
Shares Sold: 10.93 mil
Value of Shares Bought: $835 Mil
Value of Shares Sold: $556 Mil

Christmas List Series:

Next up in this 5-part Series:

  • Part IV: A Video iPod from Apple (AAPL)

Future Wish List Items:

  • Part V: A Blackberry Pearl from Research in Motion (RIMM), using the Verizon Wireless (VZ) Network

A Garmin for my Lexus

Making a Christmas List - Part II

I need to know where I am going by using a Garmin in the new Lexus LS that I am asking for. I don’t have GPS in any of the cars I own and I honestly don’t know why!

I feel that this technology is a necessity for every car on the road and have nothing but the best to say about the product after using it extensively in Hawaii (earlier this year). I found GPS to be very reliable while using a loaner car over the summer while venturing out to Pennsylvania for a friend’s wedding. I would have been lost without a Garmin and always feel so secure when traveling with the unit.

I find the products to be competitively priced for an ideal holiday gift.

112607_grmn_daily.png

Garmin (GRMN) is up about 900% since its debut as an IPO during the past seven years. The stock peaked earlier this year with a 1,126% gain since the IPO. It more than doubled in 2007 before consolidating during the current pullback towards the 200-day moving average.

Garmin took off in May 2007 after crossing the $60 level , successfully completing the $60-$100 run in less than three months.

Garmin was a stock I owned earlier this year and is one that I would not hesitate to buy again based on its leadership status but right now is not the right time based on pure technical analysis.

I am looking for a solid base formation at or near the 200-day moving average that could take months to develop (be patient). Look back and you can see that the stock traded sideways for many months before blasting to new highs in the second half of 2007. I can’t setup the proper risk/reward strategy until I can see a base and/or change in the current short term down-trending correction. I will watch and revisit this stock if and when the ideal buying opportunity presents itself.

Earnings Watch:
FY 2005: $1.37
FY 2006: $2.35
FY 2007: $3.55E (looking for a 51%+ increase over last year)
FY 2008: $4.36E
FY 2009: $4.99E

ROE: 43%
ROA: 42%
P/E: 29x
PEG: 1.47

112607_grmn_wkly.png

Institutional Analysis:
Total Institutions: 585
Money Market: 306
Mutual Fund: 254
Other: 25

Shares Held: 117.86 mil
Shares Held Previous Period: 106.89 mil

Shares Bought: 24.09 mil
Shares Sold: 13.12 mil
Value of Shares Bought: $2.8 Bil
Value of Shares Sold: $1.5 Bil

Garmin (GRMN) Coverage on the blog:

  • Should we Accumulate Shares?

    GRMN – 82.32, the former high flyer is down $40 as it approaches the 200-d m.a. for the first time since early 2007. A base here is a great accumulation opportunity.

  • Tracking Garmin (GRMN)
  • Indicators and Research Save me Money

    I saved the portfolio $4,000 in profits from my sales on Friday and Monday (GRMN and SLW).

  • Support at the 200-day Moving Average

    GRMN - $49.69 -sitting on the 200-day moving average!

  • Ten Stocks to Watch

    GRMN – $47.18 ($95.35) down over 2% for the week but the stock continues to hold the 50-d m.a. as support while maintaining a presence near the psychological triple digit threshold. I still like the stock in a rallying market (could make a nice option play for a solid run).

  • MSW Market Overview

    Looking at the MSW Index, we see that every stock fell for the week, so which ones dropped the least?

    GRMN: -1.75%
    TS: -2.71%
    GRMN - $49.12 ($99.26), These were the only qualifying stocks from the MSW Index that fell less than the major indexes. Garmin (GRMN) fell less than every major market index and found support near $95 and the 50-day moving average. It did qualify for distribution, the first in 13 full weeks.

  • Interesting Stocks with 15% of a New High

    GRMN – $31.88 ($64.42), flirting with the 50-d m.a. as the stock sits in the $60 range but is not a an official $60-$100 candidate until it can breakout above the recent peaks set at $70.07 and $68.88

Christmas List Series:

Next up in this 5-part Series:

  • Part III: A New Suit from The Men’s Warehouse (MW)

Future Wish List Items:

  • Part IV: A Video iPod from Apple (AAPL)
  • Part V: A Blackberry Pearl from Research in Motion (RIMM), using the Verizon Wireless (VZ) Network

My Lexus by Toyota Motor Corp (TM)

Making a Christmas List – Part I

It’s that time of year (Thanksgiving) when my family pulls names from a hat and then must buy a gift or gifts for the person they draw. We all add gadgets, toys, dreams and/or necessities to a large wish list that gets mailed back and forth prior to the turkey dinner.

So what’s on my wish list this year?

Let’s start big in Part I.
It’s probably not going to happen because this wish list gift exceeds the spending limit but I’ll ask for it anyway.

A BRAND new 2008 Lexus LS (How about that)!!!

Have you ever watched Entourage on HBO? If so, I’ll take Ari’s car. Outside of an Aston Martin DB9, this is the next car on my list. Luxury, style, quality and affordable!

112407_tm.png

I bought my first used Lexus in June 2002 when the stock was trading in the $40 range. Toyota Motor Corp. (TM) went on to make a 245% gain over the next four years as I added more than 100,000 miles to the car. I should have taken a car loan and placed the $10k into the stock which would have paid for everything and more with that gain. Unfortunately, I paid for the car in cash and never bought the stock.

I was sold for life over the past five years as I took that car close to 200,000 miles from 70k without a problem. The paint job on that ES300 still looks better than some new cars on the road today.

Based on the experience of my ES300 and my wife’s Jetta, we decided to be Lexus buyers for life. I gave my wife a “December to Remember” in January 2006 when we bought her a certified pre-owned Lexus. It has been every bit as amazing as the first used Lexus. She loves the car and can’t wait to look towards the SUV’s offered by Lexus when we start thinking about children.

Why buy used? I let the other guy or gal eat the depreciation. Why buy a $50,000 car when you can get it for $25k (and it holds its value better than most cars at this point)?

And that’s exactly what I did with my most recent purchase of a used Lexus GS 300. I much rather buy a used Lexus with a few years of wear and tear than a brand new junk box that sells for $25k as well.

Back to the stock:
Toyota (TM) recently violated the 40-week moving average (200-d moving average) which it has held as support over the past four years. Volume is increasing as the stock begins to stumble for the first time since I have been a proud owner of their products (and I will continue to buy from this exceptional company).

I would like to own the stock in a new longer term portfolio I am building for my family that trades more like a Peter Lynch fund with stricter sell rules. I am looking for a consolidation phase that will allow the stock to base before I will grab my first round of shares.

I don’t want to enter a position until the 10-week moving average crosses back above the 30-week moving average. I use this type of technical analysis from the studies of Victor Sperandeo and his four decades of experience on Wall Street.

112607_tm_crossover.png

The $70 to $80 trading area seems like an excellent accumulation area based on the range formed in 2004 and 2005. I can say if TM will fall this far but the first major basing pattern and moving average crossover will be my signal to enter.

Earnings:
5-Year Annual Growth: 27.44%
FY 2005: $6.66
FY 2006: $7.15
FY 2007: $8.55
FY 2008: $9.96E – a 16.49% increase
FY 2009: $10.86E

ROE: 15.48%

I’ll keep a close eye on the institutional sponsorship.

Institutional Analysis:
Total Institutions: 478
Money Market: 324
Mutual Fund: 137
Other: 17

Shares Held: 78.55 mil
Shares Held Previous Period: 74.63 mil

Shares Bought: 11.33 mil
Shares Sold: 7.4 mil
Value of Shares Bought: $1.3 Bil
Value of Shares Sold: $851.39 Mil

Next up in this 5-part Series:

  • Part II: I need a Garmin (GRMN) for my Lexus!

Future Wish List Items:

  • Part III: A New Suit from The Men’s Warehouse (MW)
  • Part IV: A Video iPod from Apple (AAPL)
  • Part V: A Blackberry Pearl from Research in Motion (RIMM), using the Verizon Wireless (VZ) Network

Next Page »