“Successful speculation implies taking risks when the odds are in your favor.”
– Victor Sperandeo
This year’s list contains 20 growth names to watch in 2022. That is ALL this list is, a personal watch list that can and will change over the course of the year, so please do not take it as a recommendation to buy, hold or sell any security.
I currently own six of the names on this year’s list with several new names that I have never owned and a few names that I have owned in the past that I believe will continue to perform.
Please understand that I have several portfolios that I manage for my family:
- Growth Portfolio (active)
- IRA Portfolio (passive)
- Index Funds (passive)
- Crypto Portfolio (active & passive)
I must reiterate that my annual blog post, Stocks to Watch, targets equities that I may trade within my active investing account, a growth stock account that’s more active than my conservative accounts (IRA, 401ks, index funds and our direct company owned stock). This growth account represents roughly a quarter of my investable net worth, per the accounts listed above. I will not disclose the number of shares or the size of the accounts as this is personal information. What I will disclose, here and on twitter, is what I own, what I buy and what I sell – and when I do it. I do believe in being transparent with the equities that I hold as well as the equities I don’t when discussing them on the blog or social media. I have been on Twitter since 2009 and I have not sold any services, newsletters or make any of my income from this blog or twitter.
Please look at my blog and my twitter account as my own personal online diary. This diary contains success stories, mistakes, lessons learned and lessons to be learned. I am not a professional investor or money manager and I am far from perfect when making a watch list and investing my own money.
I make mistakes, but based on my 23 years of investing experience, my consistency in identifying market trends and individual market leaders has improved considerably over the years. I don’t have all the answers and everyone must understand that winning and losing are part of the investing game. Every investor loses money and has ideas that don’t pan out, that’s the price for playing the game. Based on my experience, I know the investors that last and make consistent profits are the ones that learn how to manage their money properly (position sizing), control emotions and remain patient, sticking to their rules.
Please do not follow anything I do blindly – every trader and investor must do their own due diligence, have their own plan and know their own timeframes for their own personal portfolios.
I don’t trade for a living nor do I aspire to trade for a living. I invest to increase my overall net worth and to “play the game”. I enjoy trying to beat the market averages by making my own decisions in individual stocks. Some years this works and in others, it doesn’t. But this is also why I diversify my net worth across active and passive investment portfolios.
In 2020, my growth portfolio returns crushed my IRA and index funds but in 2021, my index funds outperformed my IRA and growth portfolio. My crypto portfolio outperformed them both, in both years. It’s anyone’s guess what will outperform in any given year, so this is why I diversify my dollars.
Similar to prior years, I have generated a watch list that identifies trends and stocks that I believe will grow for years to come. I do NOT want to be in-and-out of positions quickly. I prefer to hold my positions over time but 2021 re-taught me the lesson to cut losers a little quicker and take some profits when the technicals get well above historical norms (i.e.: a stock that trades 100%+ above its 200d ma). We want to learn to be patient during drawdowns and negative headlines, knowing the story of the underlying stock has not changed but at the same time, be cognizant of the risks, should action need to be taken. This is a lot easier said than done, especially in today’s world of instant satisfaction and gratification.
I try to avoid posting the latest fad list of growth stocks that may pump up quickly in the matter of weeks or months only to worry that they will they collapse just as quickly on the back side.
I screen, watch and then buy stocks based on a few simple parameters:
- Great product, service and brand
- Rising sales QoQ and YoY
- Rising EPS QoQ and YoY or EPS looking to turn positive (from negative territory)
- Increasing institutional sponsorship
- Technically: grabbing near support, at a breakout or within a base (near the 50d or 200d moving average)
That’s really it – I keep it simple. My foundation for growth stocks is based on the CANSLIM philosophy, created by William O’Neil.
I must repeat what I say every year and will continue to repeat every year until it no longer makes sense:
The annual “Stocks to Watch” list often includes newer and up-coming growth stocks that I own or candidates I am looking to own. Stocks such as AAPL, AMZN, GOOGL, MSFT, NFLX, FB, V, MA, etc. should be owned in almost every portfolio already, whether in your active trading account or a more passive retirement account, such as an IRA. This is where I own these stocks. I believe these stocks will all likely double or triple over time, once again. Own an index fund as well and add dollars to it annually, during up and down years – just do it and check back in 30 years.
Honestly, 95% of all folks should just own index funds and call it a day and forget about trading or investing in individual equities.
The bottom of this blog posts lists the equities that I currently own in our growth portfolio, our IRA and our crypto account.
“Know what you own, and know why you own it” – Peter Lynch
Beyond today’s list, I still believe in many of the industry trends and names that I highlighted in 2020 and 2021:
Trends that will continue for years to come, with notable names that I still like and/or own:
- E-commerce: SHOP, SE, PINS, ETSY
- Payments: SQ, PYPL
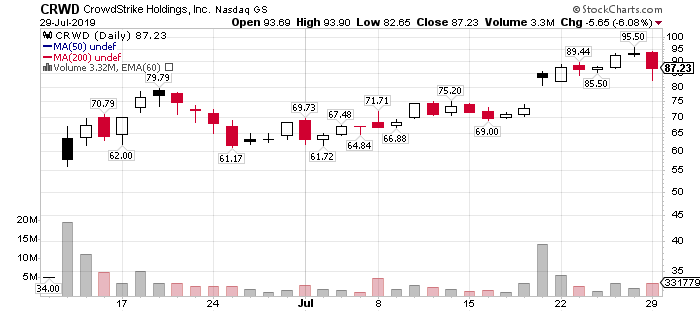
- Security: CRWD, OKTA, ZS
- Edge & Cloud: NET, APPS, TWLO
- Database: MDB, DDOG, PLTR
- Health: TDOC
- Streaming: SPOT
- Digital Adv: ROKU, TTD
- Tech Utilities: ZM, DOCU, CRM, U, FVRR
- Services: UBER, ABNB
Enjoy my 20 Stocks to Watch for 2022, in alphabetical order:
ABNB, AFRM, APPS, ASAN, COIN, CURI, DDOG, DOCN, GENI, GLBE, INMD, MQ, NET, OPRX, RBLX, SI, SOFI, U, UPST, ZI
I currently own six stocks on this year’s Stocks to Watch 2022 watch list:
APPS, COIN, DDOG, GENI, GLBE, MQ


Connect with Me