 I‘ve had a question through e-mail about my Fibonacci retracement charts and how they were late to calling the bottom of the NASDAQ market. That is fine because I don’t need to spot the “exact” bottom of a market, I just need to spot the reversal and hop on. Those of you that follow MSW and this blog on a weekly basis do know that one of my strongest talents is nailing market reversals when they happen because it’s something I have done for years while investing in strong, young growth stocks.
So, I invite everyone to visit this post titled: Déjà vu on the NASDAQ? posted up on Wednesday, July 26, 2006 and determine for yourself if I did see the bottom developing.
Here is some of the text from that blog entry and the chart I posted almost three months ago (July 26, 2006) and an updated chart from my annotated stockcharts file:
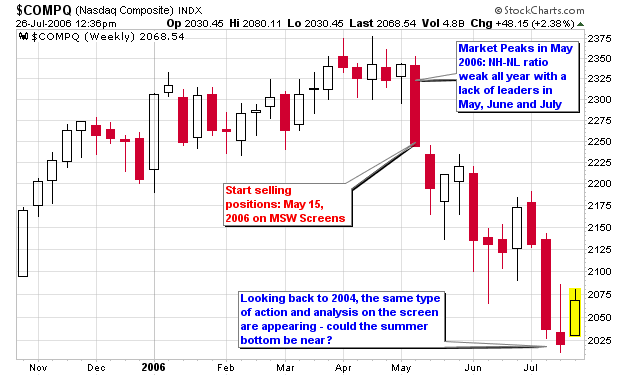
7/26/06: “As I was researching my archives on MSW (the archives from 2004 and 2005 are open to everyone) I found some interesting data that correlates the NASDAQ in 2004 and 2006. So far in 2006, we have had 15 down weeks and 14 up weeks. At this time in 2004, we had 19 down weeks and 10 up weeks and the NASDAQ was at a nine month low (very similar to now as we are near 10 month lows). In 2004, my daily and weekly screens started to turn south on May 9th; in 2006, they started to turn south on May 15th (about the same time).
If you look at the two charts presented in this blog entry, you will notice how the market started to weaken in May and June and with a bottom near the end of July into early August. This summer is not over but I am wondering if the pattern will turn out to be similar to the one from 2004. The old saying: “sell in May and go away” has held up over the past couple of year with opportunities resenting themselves during the fall (towards the end of October).
Several of things I was saying back in 2004 are very similar to what I have been saying over the past two months. The similarities are amazing and the current NASDAQ chart may be forming a pattern that could take a similar route as it did in August of 2004. Only time will tell but history repeats and traders are always learning from history.
NOTE: when I say history repeats; I am not saying that it repeats exactly but the charts do resemble similar formations and seasoned traders and investors can capitalize on these situations.”
Click the link for the rest of the post! Déjà vu on the NASDAQ?
Piranha


Speak Your Mind