Archives for 2006

Talking Heads at it Again!

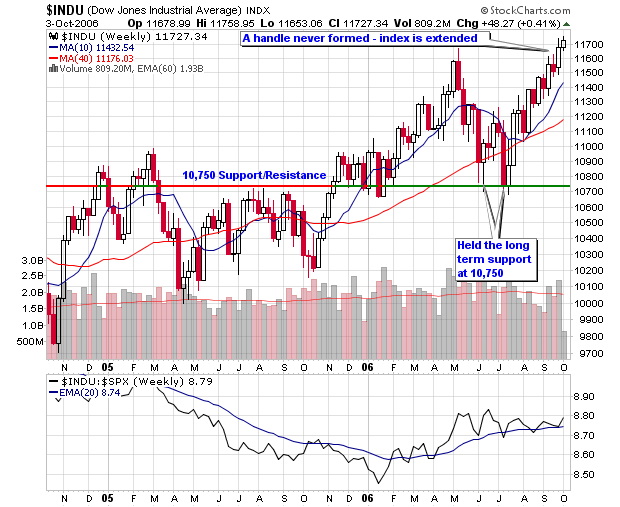
As we all know the DOW set a new record close by finishing at 11,727.34, surpassing the prior closing high of 11,722.98 set back on January 14, 2000. The index was up 0.5% or 56 points as crude oil fell to a 14-month low based on assumptions that lower energy prices may boost consumer spending and hold off an economic slowdown. The NASDAQ was up 0.3% to close at 2,243.65 as it is still miles away from all time high that was set back in 2000 at 5,132.50. The S&P 500 closed at 1,334.11, up 0.2%, as it is within a short distance of its all-time high of 1,553.11.

With all of the excitement surrounding the new closing high, I would like to focus on what the “Talking Heads” are saying. What is a talking head? Please see a post I wrote years ago titled: Ignore “Talking Heads” because they are usually wrong!

Here are some quotes from talking heads today:

  • “Now that you have a definitive new all time high, the fact that it is the Dow and the most recognized index, that is the type of thing that will shine the spotlight on the market,” said Charles Carlson, who oversees $105 million at Horizon Investment Services LLC in Hammond, Indiana, and who wrote “Winning With the Dow’s Losers,” published in 2004. “This could get people interested in stocks.”

Read that last quote! “This could get people interested in stocks”. The only people that get interested at this point in time is dumb money! When “people” such as your mother-in-law, the barber and the taxi driver start talking about the DOW and its all-time high; it’s probably time to get ready for a huge blow-out where smart money takes advantage of dumb money and laughs all the way to the bank. Be careful out there because the wheels will fall off when “people” get interested in stocks.

Another ‘talking head” on a major financial site:

  • “Investors are concluding that the economy is in for a soft landing,” said Hugh Johnson, chairman of Johnson Illington Advisors. “They expect the good news about the decline in oil prices to offset the negative impact of a deteriorating housing market.”
  • “What’s most interesting”, Davidson said, “is not that the Dow has broken through to a new record, but that it has taken the market this long to get to a point at which stocks seem to be fairly valued relative to earnings expectations.”

Who cares, analysts were saying Enron was a buy and fairly valued at $60 before its infamous decline. By the way, talking heads recommended Enron all the way to $12 per share from $60.

  • Scott Wren, senior equity strategist at AG Edwards was cautious about the importance of the Dow’s milestone. “It’s probably of more significance to the retail investment community than it is to the professionals,” he said.
  • “But I do think its a psychological plus and one that could spark some interest and maybe bring a little bit of sideline money into the market.”

From MSW Money:
Twenty-three of 30 stocks in the Dow were higher on the day along with 304 S&P 500 stocks.

  • The rally is a reflection of investor “belief in the sustainability of growth,” Maury Harris of UBS Securities told CNBC’s “Power Lunch.” While the economy may be slowing, it will be a modest pullback at worst, he said. And, added Peter Hooper of Deutsche Bank Securities, investors believe the Fed won’t be cutting interest rates but will step in to support the economy.

When I hear things like this, I start to lick my chops and get ready to short the hell out of the market. These talking heads don’t know what is going on and continue to pump a market and economy that is extremely extended and due for a pull-back. I really don’t know when that correction will start but it will and I am jumping on at the first signal. To be honest, it could take, three days, three weeks or even three months – I don’t know but when it does happen, I put my cash to use!

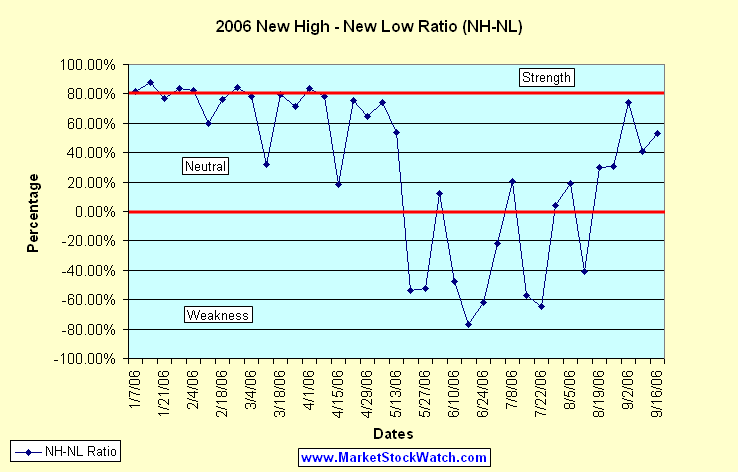
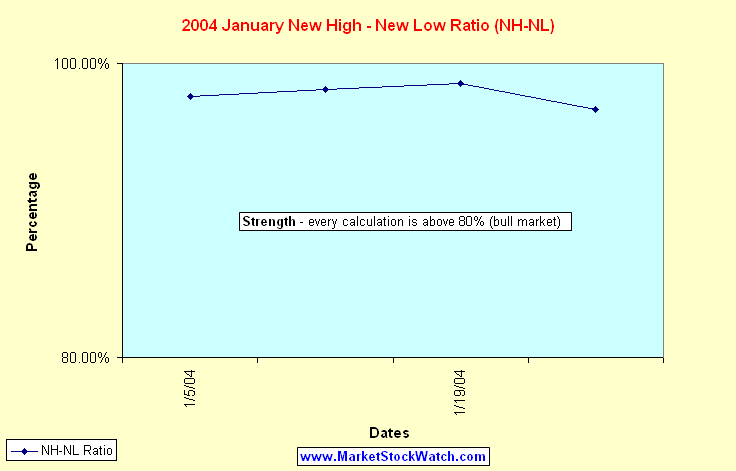
As many traders have noted, such as Trader Mike, the $SOX or semiconductor index is performing poorly which usually casts some foreshadowing of what’s to come. In addition to the $SOX acting poorly, small caps and other bull market leaders are not stepping to the plate to propel the indexes higher. The NH-NL ratio is weak and is not participating in this rally run and that sends the largest red flag in my opinion. Without the support of small cap growth stocks, you wouldn’t expect this rally to continue. I have been bearish on the Ticker Sense Blogger Sentiment Poll for the past four weeks as the market has moved higher and remain that way.

Some sectors acting poorly on Tuesday were energy stocks, computer hardware and gold stocks. Sectors moving higher Tuesday included airlines (they typically move higher when oil stocks move lower), brokers and some medicals.

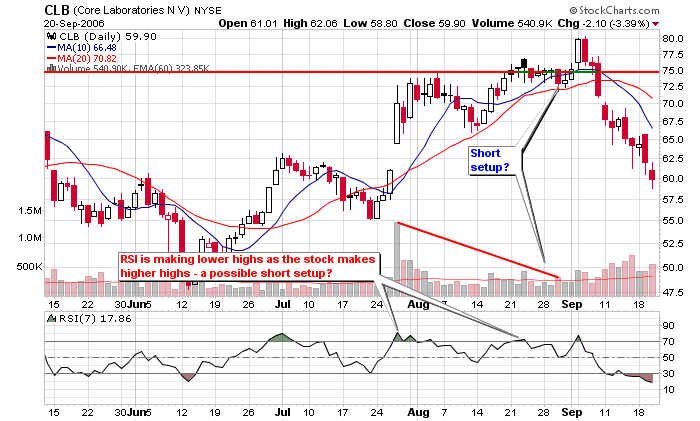
Marvel Technology (MRVL) led the semiconductor group lower as it gapped-down and closed with a 12% loss on the largest daily volume in months. The stock is back below its 50-d moving average and is well below its 200-d moving average. The proper CANSLIM short should have come when the stock failed to recover the 200-d m.a. back in mid-June. Similar to the stocks listed on last night’s MSW screen, MRVL can be a poster stock for what to look for in possible shorts.

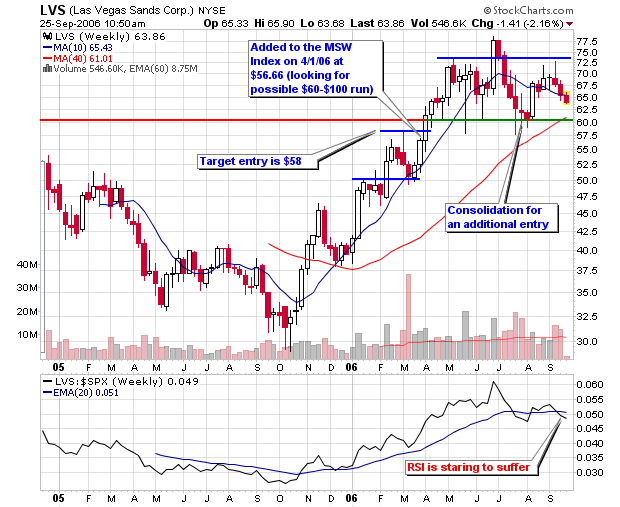
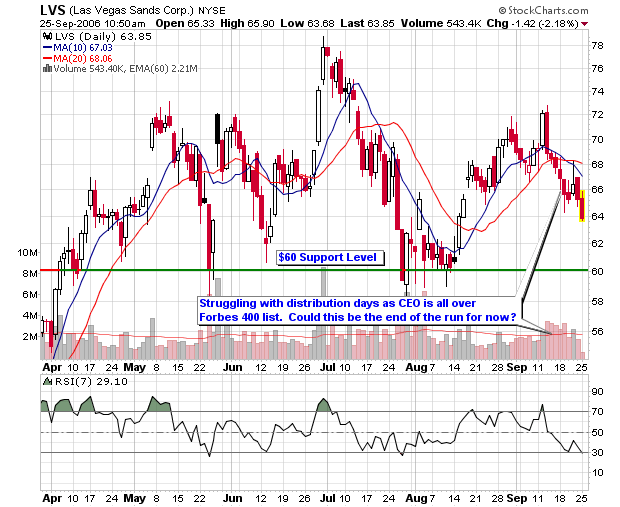
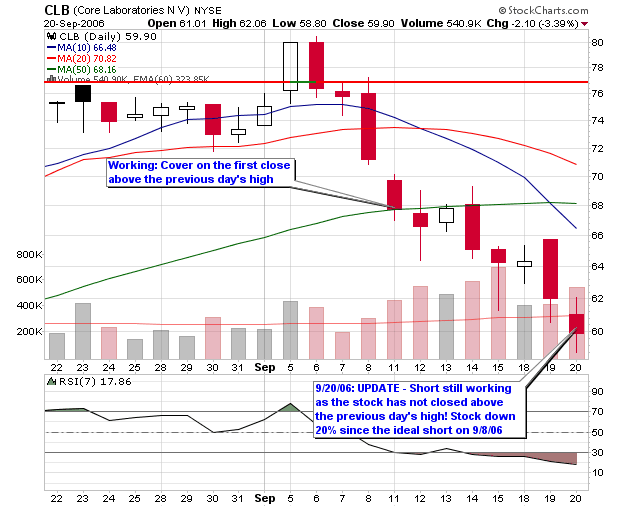
I have included some charts of the major indexes which shows why I am looking for a pullback and why my screens are focusing on potential shorts.
Piranha

Big Caps still moving after 3 Months

Howard Lindzon made a blog post yesterday titled “New Highs are THICK and BIG BIG BIG CAPS in nature”

He goes on to write that companies such as American Express, Banc of America, McDonalds, Harley Davidson, International Game Technology, American Eagle, Autozone, Allstate, Nike, & Verizon are all looking good on the charts (possible breakout heaven).

I agree and have been writing about large caps making a move since July with my first major post highlighting McDonalds and the chart of the S&P 100 Index/S&P 600 Small Cap Index. TraderMike brought this chart to my attention earlier in the summer from his own blog post.

Here are the links to my original posts highlighting the gaining strength among BIG CAP stocks:

July 18, 2006
Large Caps Gaining Strength
“The chart associated with this post is telling us that Large Caps are gaining strength versus Small Caps. Time will tell but yesterday could have been the first round of confirmation.”

July 17, 2006
MSW Market Overview
” tend to rely on the NASDAQ more so than the DOW but it is interesting to see that large caps are gaining some steam while small caps are getting trounced.”

July 21, 2006
Ten Stocks to Watch
“The S&P 100 Index/S&P 600 Small Cap Index that I track is up over 6% this week for its largest gain in years, confirming that large caps are moving to the head of the class.”

Piranha

Las Vegas Sands – LVS

I am sure many of you have seen the latest Forbes 400 list by now but if you haven’t, take the time to read over the list and pay careful attention to an article titled :
Another Hour, Another Million

The article is about Sheldon Adelson, the owner and CEO of Las Vegas Sands, LVS, a long time favorite of the MSW screens in 2006. The man was worth approximately $3 billion just two years ago but his wealth has skyrocketed to more than $20 billion since taking LVS public. According to the article’s calculations, Mr. Adelson, could surpass Bill Gates as the richest man on the planet by 2012 if all variables remain relatively equal. He has earned about $23.6 million per day and almost $1 million per hour over the past two years.

Why does this interest me? Because I have owned shares earlier in 2006 and currently own new shares in his public company: LVS. I bought shares back in the first week of April and sold them in July as the stock took out the 50-d moving average. After catching support near $60 in July (above the 200-d m.a.), I entered once again in August but have not profited this second go-around (at this point in time). I am now even with my latest position and have become concerned with the CEO making headlines with his own article in Forbes. I have learned from past market experts such as William O’Neil, Bernard Baruch and Gerald Loeb that headlines could be the sign of trouble ahead, at least for the stock.

Looking at the charts, my stop is near (slightly below) the support level of $60 so I will monitor the situation closely to make sure a loss doesn’t grow. I have already told a few people that a hedge to protect the down side may be warranted but the most important thing is to follow your rules and original objectives in the trade.

I have provided some of the analysis I have posted to the MSW Index over the past six months. I selected a couple entries from each month as selecting all would take up too much space on the blog. When listed on April 1, 2006, support was placed at the 50-d m.a. with an entry at $58. This was triggered the following week and away we went! The stock was up over 37% within three months on the MSW Index before topping and consolidating over the summer with support near $60. The stock was originally added as a $60-$100 candidate and was off to the races but hit a dead summer dry spell and corrected. Time will tells us when this stock is headed!

4/1/06: LVS makes its first MSW Index
LVS – 56.66, The stock has been screened many times (daily) over the past several weeks so I have decided to add it after further research. The stock comes to the Index as a possible $60-$100 candidate over the next twelve months. The strong 8% move this past week gives us the feeling that the young stock is ready to move. I am also looking at the September call options (in the money calls).

4/8/06:
LVS – 61.41, I said I felt the stock was ready to move and I was right as I added it to the MSW Index last week. The stock gained 8.38% on above average volume as it entered the $60 trading range. I see the stock settling down and pulling back a bit before resuming the advance. Rating: Hold

4/15/06:
LVS – 64.10, The stock continues to move higher and maintain its quick success on the MSW Index. This was a $60-$100 play so give it time to work out and stay patient. Rating: Hold

4/22/06:
LVS – 63.97, A break from the action this week as the stop slipped slightly as volume was near average. The stock is extended from the 200-d m.a. so look for a new entry to form. Rating: Hold

4/29/06:
LVS – 64.81, Earnings come out this Thursday so be ready for that up or down swing. If numbers keep in-line with past reports, I expect the stock to beat expectations and move higher (a hard stop is advisable to protect from bad news). Rating: Hold

5/6/06:
LVS – 71.32, Up over 7% on Friday, bringing the weekly gain to 10% after earnings came out positive. The move was anticipated if earnings stayed in line with the past (as I noted last week). The stock is up 26% in one month on the Index. Rating: Hold

5/13/06:
LVS – 68.12, Down 4.49% this week as the stock holds a RS rating of 95 and remains above the most recent breakout area of $65 (our first level of support) Rating: Hold

6/10/06:
LVS – 65.50, The stock is trading on the 50-d m.a. and managed to gather some support when it violated the line on Thursday. The market is weak but I still have the stock targeted for the run from $60 to $100. Rating: Hold

6/24/06:
LVS – 66.87, Still trading along the 50-d m.a. with an upward bias. This is the type of stock that I like to buy longer term options for the possible $60-$100 run. I would look at December or January options (in the money options are best IMO). The market is weak but I still have the stock targeted for the run from $60 to $100. Rating: Entry is now for $60-$100 run

7/01/06:
LVS – 77.86, What can I say – the stock broke out and is powering through the $60-$100 run regardless of the overall market environment. It traded sideways for seven weeks before making a huge move this week – signs of a great stock. Rating: Final entry passed last week

7/08/06:
LVS – 73.81, A pullback after the breakout last week. The stock is showing support above the short term $73 level. A break below $73 will probably bring the stock back towards $70. Rating: Wait to see if it will continue pullback towards $70

7/29/06:
LVS – 62.77, Last week I said: “The weekly chart shows strong support near $65 as a drop below this level will bring the stock back down near $60.” As I said, the stock visited $60 and managed to close slightly above the area. Rating: the $60-$100 run has been hurt with major distribution in July but I am keeping the stock around for another week. It is does close below $60 and stay there, LVS is gone from the MSW Index.

8/12/06:
LVS – 60.33, Six consecutive down weeks but the weekly chart is still suggesting that buyers are starting to step back into the stock above $60. If it does close below $60 and stays there, LVS is gone from the MSW Index. Three weeks of distribution during the recent slide but a support area may be forming. Rating: Hold at current level with a sell below the 200-d m.a.

8/26/06:
LVS – 66.27, The stock is meeting resistance once again but has setup a double top breakout above $69 on the P&F chart. The decline last week did not qualify as distribution since the volume was below average. Still a hold in my book with the $60-$100 advance remaining a possibility as long as it trades above $60. Rating: Hold at current level with a sell below the 200-d m.a.

9/9/06:
LVS – 69.26, Clinging above the 50-d m.a. but volume was lighter on Friday as it moved forward by 2%. If LVS starts to struggle making higher highs, holders should become concerned. Institutional support is there but they can bail and the volume will be the story teller. Rating: Hold at current level with a sell below the 200-d m.a.

9/23/06:
LVS – 65.27, Sheldon Adelson has been making the news everywhere this weekend after his making a splash on the latest Forbes 400 richest list. He is the owner of LVS and has allegedly made just under $1 million per hour over the past two years. I am going to write a lengthy blog post about LVS and the appearance of the CEO all over the news. Could this be the start to a long slide? You heard it here first as I am now concerned. We all know that many stocks collapse when their CEO’s make the major news networks and magazines. Rating: Hold at current level with a sell below the 200-d m.a. I may short sell if it closes below the 200-d m.a.

Piranha

CLB was my Home Run

On August 30, 2006, I posted up a few short opportunities based on a strategy I have started to study and use. Similar to baseball, low averages can still make you a lot of money. What do I mean?

A player that hits .300 for a career or records an out 70% of the time has a good chance to make the hall of fame. The same holds true for stocks because a couple home runs here or there can make your entire year.

Core Laboratories will not make my year but it is one short that has made quite the impression my new technique. The stock is now down over 20% since I caught the short setup in late August. Yes, I am gloating but it’s because I am excited to see a home run so early while trading these new setups (new for me at least).

A CANSLIM investor may toss aside a 20% gain as average but this is not a CANSLIM tactic, it’s a short term strategy that is supposed to be closed within days and sometimes hours. CLB is still an open winning trade from a couple weeks ago as the stock has traded down 9 of the past 11 days but has never closed higher than the previous day’s high.

Volume has been larger on down days and the RSI has completely broken down. John Carter recommends that a trader should start watching intraday charts as the trade becomes extended so you can close out with a solid profit. However you setup your stop; DO NOT let the profit erode as that could be devastating to your emotional balance. Of the four stocks selected in late August, one worked in the short term, one failed miserably, one broke even and one was a home run. The losers or break-even stocks were cut short with minimal losses so they don’t matter to the overall portfolio. You can win 30% of the time in the market and still be very profitable! Here I recorded a 25% win ratio but the winner was big so it eclipsed the other trades and puts me in the green!

The original post can be found though this link:
Possible Short Setups

One last thing: you will notice that the gap-up from late July has been filled and it has taken two months.

Piranha

NH-NL Ratio still Neutral

After a great response to the weekly market review I added on Friday, I felt it was necessary to update the NH-NL ratio chart to show how this indicator feels about the market. We have had five consecutive positive weeks for the first time since April 2006 but we are hovering in a neutral zone near 40% with a brief spike above 70% a couple weeks back. The month of April 2006 averaged 64% while the first week was in bullish territory above 80%, something we haven’t seen since.

I often get a question about the difficulty of this calculation to stay above 80% and I respond with the ratios from 2003 and 2004. Below is a sample of the data extracted from January 2004 when the ratio averaged 97% for the entire month. The readings were as follows (chart below):

Sunday, January 4, 2004: 892-10 (97.78%)
Sunday, January 11, 2004: 792-7 (98.25%)
Sunday, January 18, 2004: 896-6 (98.67%)
Sunday, January 25, 2004: 505-8 (96.88%)

Where do the Major Indexes stand in 2006?
NASDAQ: +1.38%
DOW: +7.81%
NYSE: +8.21%
S&P 500: +5.84%

Below is an updated look at the weekly averages for the NH-NL Ratio:
Saturday, January 14, 2006: 500-32
Saturday, January 21, 2006: 348-46
Saturday, January 28, 2006: 516-46
Saturday, February 4, 2006: 449-44
Saturday, February 11, 2006: 229-57
Saturday, February 18, 2006: 306-42
Saturday, February 25, 2006: 420-36
Saturday, March 04, 2006: 399-49
Saturday, March 11, 2006: 162-84
Saturday, March 18, 2006: 459-53
Saturday, March 25, 2006: 312-52
Saturday, April 01, 2006: 441-39
Saturday, April 08, 2006: 481-58
Saturday, April 15, 2006: 150-103
Saturday, April 22, 2006: 540-75
Saturday, April 29, 2006: 353-76
Saturday, May 6, 2006: 503-74
Saturday, May 13, 2006: 384-116
Saturday, May 20, 2006: 64-211
Saturday, May 27, 2006: 57-182
Saturday, June 3, 2006: 119-93
Saturday, June 10, 2006: 72-204
Saturday, June 17, 2006: 41-310
Saturday, June 24, 2006: 56-238
Saturday, July 01, 2006: 127-198
Saturday, July 08, 2006: 143-95
Saturday, July 15, 2006: 74-273
Saturday, July 22, 2006: 66 – 307
Saturday, July 29, 2006: 163-151
Saturday, August 5, 2006: 194-132
Saturday, August 12, 2006: 88-210
Saturday, August 19, 2006: 178-96
Saturday, August 26, 2006: 140-74
Saturday, September 2, 2006: 285-42
Saturday, September 9, 2006: 143-60
Saturday, September 16, 2006: 244-75 – This Week

Piranha