Stock of the Day
Omniture, Inc
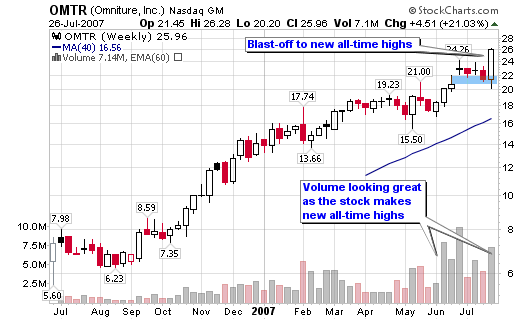
Thursday’s Closing Price: OMTR – $25.96
Sector: Technology
Industry: Business Software and Services
52-week Price: $7.35 – $26.28
Market Wire: Omniture, Inc. (OMTR), a leading provider of online business optimization software, today announced results for its second quarter ended June 30, 2007. Omniture reported another record revenue quarter, with second quarter GAAP revenue of $33.5 million, an increase of 78 percent over the second quarter of 2006 and 15 percent over the first quarter of 2007. Non-GAAP revenue for the quarter was $34.1 million.
My Take:
The charts look great, especially when compared to many of the market leaders over the past week or so. The weekly chart shows a strong price and volume move into new all-time high territory while the point and figure chart shows several consecutive ascending triple top breakouts.
I have also been looking deeper into the numbers with this stock. Revenues are steadily increases quarter over quarter and year over years (as you can see in the breakdown below). Earnings were negative last year but fell within analyst expectations and are expected to turn positive going forward from an actual loss of ($0.08) in 2006 to a profit of $0.65 by 2009. A typical growth stock usually rises in price as earnings make strong gains from year to year. Net income was still negative last year but the negative numbers decreased by 55% as it heads to positive territory. Overall, things are looking positive both fundamentally and technically so I will now setup an ideal trade opportunity.
Potential Trade Set-up:
I would risk 1% of the total portfolio
My ideal entry would be near $24
Set a stop loss of 10% or near $21.60 ($19.89 would be the best area with a lower entry)
Target price will be about $35 (complete speculation)
At $35, the risk-to-reward will be just above 4-to-1
At $30, the risk-to-reward declines to 2.5-to-1
So, a $100,000 account will give you
Entry: near $24
1% Risk: $1,000
Stop Loss: 10%
Position Size: $10,000
Shares: 417
Stop Loss: $21.60
Target: $30-$35
Institutional Analysis:
Held by Institutions: 45 %
Money Market: 56
Mutual Fund: 82
Other: 4
Shares Held: 30.33M
Shares Held Previous Period: 24.25M
Shares Bought: 14.94M
Shares Sold: 8.85M
Value of Shares Bought: $278.0M
Value of Shares Sold: $165.0M
Top Institutional holders, Shares Held:
Fidelity Management & Research Corp, 7,322,298
Crosslink Capital. Inc. , 2,350,228
Fidelity Growth Company Fund, 1,691,626
Maryland Capital Management, LLC, 1,300,000
Next Century Growth Investors LLC, 1,291,115
Key Fundamental Numbers:
Market Cap.: $1.5B
Outstanding Shares: 49.2M
ROE: (22.29%)
ROA: (5.02%)
ROI: (9.72%)
Price/Sales: 13.80x
Price/Book: 13.61x
Gross Profit Margin: 61.30%
Operating Profit Margin: (7.83%)
Net Profit Margin: (7.32%)
EPS Growth (MRQ): 32.17%
EPS Growth (TTM): 63.46%
Revenue Growth (MRQ): 77.37%
Revenue Growth (TTM): 80.60%

Revenue (millions):
Yearly (2006): $79,749
Yearly (2005): $42,804
Yearly (2004): $20,566
Yearly (2003): $8,654
Yearly (2002): $3,715
Earnings:
Yearly (2009): 0.65E
Yearly (2008): 0.37E
Yearly (2007): 0.15E
Yearly (2006): (0.08)
Net Income:
Yearly (2006): ($7,725)
Yearly (2005): ($17,441)
Yearly (2004): ($1,318)
Company Profile:
Omniture, Inc. (Omniture) is a provider of online business optimization software. The Company’s software is used by customers to manage and enhance online, offline and multi-channel business initiatives. Omniture’s online business optimization software, which it hosts and delivers to its customers on-demand, consists of SiteCatalyst, its flagship service, and its Omniture Data Warehouse, Omniture Discover Omniture Genesis, Omniture SearchCenter and Omniture Touch Clarity services. Omniture’s services provide customers with real-time access to online business information, the ability to generate reports using real-time and historic information, and the ability to measure, automate and optimize online processes. The Company also offers a range of professional services, including implementation services, best practices, consulting services and user training provided through Omniture University. In January 2007, the Company acquired Instadia, a European enterprise Web analytics provider.


I didn’t like your mastercard pick and it did well and I do not like this one either.
Going back to June 12th insiders have sold $19 million in shares/options. I expect a certain amount of insider selling, but the levels of the last 6 weeks look more like clearance selling because they know the price high. Seriously a true Richistan event, http://www.npr.org/templates/story/story.php?storyId=10736000
I haven’t looked at the last financial reports, but I sure did not like that the net tangible assets at the end of Q1 was only $9 million and owner’s equity less than 1/10th of the share price.
It looks to me that between options and new equity they’ve gotten another $147 million in cash in, so with that in the next tangible assets are now $153 million
And this GAAP versus non-GAAP accounting, well, they’ve lost 13c/share so far for 2007. Who ever came up with the idea of excluding stock based compensation as not a “real” expense sold a double whammy snow job. This stock appears to have a stock based compensation program that is simply defective for investors, like bad DNA. It dilutes shares and then they hit you again by pretending it isn’t a real expense and if anything accounting measure should require an extra cost due to dilution. 3% dilution in a year means you need 3% plus inflation to keep up. They only get those positive eps numbers by pretending a destructive and costly to stock option plan does not exist.
I don’t see anything in the margins that suggest to me that they will actually make money. A year ago the real loss from their operations was 10.6% more than revenues, now it is 13.3% more than their revenues.
So, they get to 65c eps by pretending stock based compensations isn’t a real expense in 2009, two years from now, and it finally catches up to the rate of inflation?
Good luck with this one…
Interesting posts by Chris and Deborah — I’ve been reading mainly only technical analysis blogs and while this fundamental data is kinda scary it is interesting and I’d like to learn more. Do continue to post more posts like this one. Thanks!
In your post, you say that you would risk between
0.01% and 0.05% of your portfolio. Is that a typo? I ask because in your example, if you buy 417 shares at $24, and your stop loss is executed at $21.60, you have:
417 x (24-21.60) = $1000
On a $100,000 account, that represents 1% of your portfolio, it is not between 0.01% and 0.05%.
Terry,
Yes, that is a typo as it is clearly 1%.
Reno,
See the stocks category for dozens of posts like this with both technical and fundamental breakdowns.
Deborah,
You make some valid points but it crossed my research screens just as other great stocks have in the past. I can’t pick and choose, I must buy all opportunities and play the rules. I didn’t like buying MA and BIDU above $100 after big runs but I have to listen to the research, not my own thoughts. We’ll see what happens. FYI: I don’t own shares in OMTR at this time but I am watching for the ideal setup as explained.
Have a great weekend to all!
Hi Chris, quick question: Where do you find the institutional analysis and institutional holders information? Thanks in advance.