VISA (V) set to Launch

Visa Inc. (V) is set to launch the largest initial public offering in U.S. history on Wednesday but I doubt it will do much to help this market (from a bullish standpoint). The company is offering 406 million shares with an anticipated price between $37 and $42, according to SEC filings.

In total, the IPO could raise nearly $17 billion, surpassing the record held by the AT&T Wireless IPO from 2000 which raised $10.6 billion. The $15 to $17 billion projection is approximately 70% higher than what the market was reporting when I was anticipating this IPO last November.

“VISA, the largest U.S. credit card network said it is looking to raise $1o billion in an initial public offering, according to a registration statement with the SEC.”

JPMorgan (JPM) is one of the lead underwriters (Goldman Sachs is the other) so the market wants this IPO to launch successfully so additional fears don’t rise following the $2 Bear Stearns fire sale. A successful IPO would generate a large cash influx to banks such as JPMorgan, Bank of America and Citigroup. Visa’s IPO could generate around $500 million in fees for underwriters, according to documents with the SEC.

Shares will price after the close Tuesday with lots ready to move Wednesday morning.

As pointed out in my last post, Visa and Mastercard (MA) are not directly exposed to rising defaults and late-paying consumers because they process transactions and these transactions typically rise when credit is tight from banks. American Express and Discover are not as fortunate in this sense as they extend the credit to their card holders, exposing themselves to the defaults.

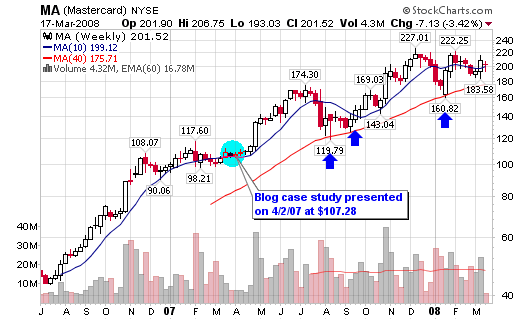
As you can see, Mastercard (MA) has held up very well during this credit crisis. It has not violated it’s major moving averages and is still in an overall long term up-trend.

031708_ma_wkly.png

November 15, 2007: Anticipating the VISA IPO

Why do I like VISA’s potential?

  • $1o Billion would represent the second largest IPO ever!
  • Revenues are expected to grow steadily as consumers continue to use their cards
  • VISA processed 44 billion transactions totaling $3.2 trillion in 2006 (Mastercard processed 23.4 billion transactions totaling $1.9 trillion)
  • VISA has made $771 million on $3.7 billion in revenue during the first nine months of 2007
  • VISA makes their money from the fees it charges to card users and merchants using its network
  • Mastercard is half the size of VISA and is up 5-fold from its IPO

BEST OF ALL:

  • Because it acts as an intermediary, Visa doesn’t sustain losses when consumers don’t repay the debts run up on credit cards bearing its brand. Those liabilities instead fall to the banks that issue the cards and set the terms of repayment
  • Most of Visa’s major stockholders are banks. They include: J.P. Morgan Chase & Co., which owns 23.3 percent of the company’s Class B Stock; Bank of America Corp., 11.5 percent; National City Corp., 8 percent; Citigroup Inc., 5.5 percent; U.S. Bancorp, 5.1 percent; and Wells Fargo & Co., 5.1 percent.

NO RISK for VISA; the banks are responsible for the cardholders that don’t pay their bills. What could be better than that? Tell me!

Challenging the 200-d m.a.

Today’s screen is covering stocks that are trading below the 200-d m.a. and are currently attempting to challenge the line for the first time since their fall from 52-week highs. The first failed attempt to recover the 200-d m.a. is typically an opportunity to short or a signal to buy put options.

However, historical charts show that the likelihood of an ideal short setup comes when the 50-d m.a. is trading below the 200-d m.a. By the time the 50-d m.a. crosses below the 200-d m.a., a second challenge is taking place and this is where I look to initiate a position. I will be watching these stocks for that type of opportunity.

031608_nuva_daily.png

031608_flir_daily.png

  • NUVA – 33.92, screened a couple weeks back as the stock is now trading below the 200-d m.a. The stock is now trending back towards the 200-d m.a., also known as the next ideal short setup.
  • FLIR – 26.36, NuVasive reversed on Friday after a failed attempt to recover the 200-d m.a. The 50-d m.a. is still above the 200-d so this will keep me on the sidelines. However, the failed recovery and a crossover in the future will catch my attention for a trade setup
  • DECK – 105.23, the stock has moved from $89.88 to $102 over the past few days as it looks to challenge the 200-d m.a. for the first time. A failed attempt to recover this line will be the first short setup/ opportunity. I would like to see the 50-d m.a. fall below the 200-d m.a. before initiating a position.
  • CRL – 56.02, Charles River is in the same boat as FLIR and DECK as the 50-d m.a. is still trading above the 200-d m.a. The stock reversed on Friday as it attempted to recover the line.
  • OII – 61.30, the stock was up almost 3% on Friday on strong volume but the 50-d m.a. recently crossed below the 200-d m.a. The downturn of the 200-d m.a. is still premature but the overall trend seems ot be turning downward.
  • STRA – 156.00, the strong education stock is starting to hit hard times as the 50-dm.a. is trending downward towards the 200-d m.a. The price is currently challenging the 200-d m.a. for the first time in years.

[Read more…]

Sign up to My Feed

My feedburner subscriptions are increasing but I don’t think many of you know that my blog posts can be sent to you via e-mail updates or through your favorite home page readers such as Google and Yahoo (among others).

Click the large icons below and sign up for FREE to get my daily blog posts in your e-mail and/or favorite reader:

Snapshot Friday

Interesting Chart Snapshots:

031308_oil_wkly.png

031308_dollar_wkly.png

031308_gold_wkly.png

031308_dow_wkly.png

031308_nasdaq_wkly.png

Reversal and a Follow-Through Day

I am not getting overly excited about the 3.55% move in the DOW, the 3.98% move for the NASDAQ and the 3.71% jump for the S&P 500. Today’s action does raise some interest but trend reversals and new bull rallies can’t be confirmed after one day of action. All major bull markets started with a reversal and then a follow-through within the next four to ten trading days.

This idea was first revealed by William O’Neil, the founder of Investor’s Business Daily, and became a cornerstone in his CANSLIM investing method. I believe this theory to be accurate but it is not an exact science. Before I describe this method, I would like to be clear that my indicators are still pointing down and my screens are still focusing on shorts. It’s a good time to write about reversals and follow-through days even though I don’t think this rally has legs but my opinions must be checked at the door.

The key to understanding this follow-through philosophy is that reversal signals usually occur after a significant market correction, not a minor market correction. The reversal and follow-through in 2003 was classic and one I like to refer back to when looking at the present market. Both the reversal and follow-through days must move at least 2% to the upside on above average volume.

031108_nas_daily.png

If today acts as day 1 of a possible reversal, then the next two days are not very important except for one fact: the market must not undercut today’s low as that would kill the start of a new rally. As long as prices stay above today’s low, the rally attempt is safe.

The follow-through day should come within four and ten days of today’s reversal although O’Neil’s original rules stated that the follow-through should come between day 4 and day 7. One of the major indexes must move higher by 2% or more on larger volume than the previous day to qualify for a follow-through. Multiple indexes participating with a follow-though shows conviction that the market has sustainability to move in the new direction.

[Read more…]