Disregard Conventional P-E Ratio Theory

Don’t base your portfolio buys on P-E Ratio alone; you will most likely miss the biggest winners of each cycle!

I use the Price Earnings (P-E or P/E) Ratio as a secondary indicator for buying and selling stocks but I don’t use the ratio in the same a manner as many value investors teach. I will explain the difference in my methodology for using the P/E ratio to your advantage.

100907_aapl_peratio.png

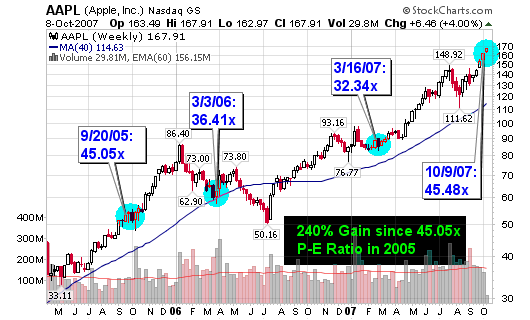
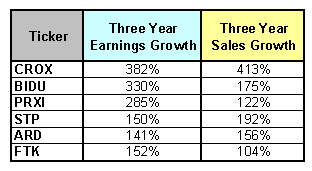
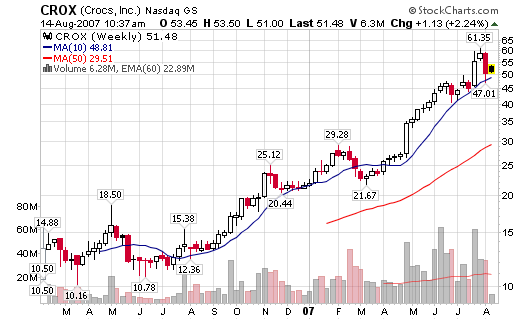
Many value investors will pass on a growth stock that has a P-E ratio higher than a predetermined level. For example, they may discard all stocks that have a ratio of 20 or higher, regardless of the industry group they come from. Some investors will discard any stocks that have P-E ratios above the industry group averages, concluding that they are grossly overvalued. I am not saying that this method doesn’t work, because it does but it will not work when you focus on buying young innovative small cap stocks that are growing at tremendous rates, rates that “big caps” can no longer sustain. Growth stocks cost more because they GROW!

[Read more…]

Inside the Fundamentals

A reader, Steven Mac, asked me if I could highlight the key fundamental points in the case studies I post on this blog. I will list his questions (in blue) below and then answer them using the numbers of actual case studies in 2007 (MA, BIDU and EDU will be my focus). Read any of these books to understand in depth what I am looking for with fundamental analysis:

Questions:

1) What is the min number of institutions you want to see holding a stock? What is the max?
2) Shares Held/Previous Period
3) Shares Bought and Sold – total interest of all participants? increasing buy demonstrating demand on expected results? sold indicating institutions are aware of some internal number or news of future performance problems?

Question #1 Answer:
I don’t have a minimum number of institutions that I would like to see holding a stock. I also don’t like to set a maximum threshold. However, I prefer to see a young growth stock have between 50 and 300 institutional investors. This tells me that it has room to grow and more “smart money’ can pour in without saturating the stock’s market.

2/6/07: EDU: 97, 8/23/07: EDU: 159 – 64% increase
4/2/07: MA: 393, 8/23/07: MA: 513 – 30% increase
4/25/07: BIDU: 255, 8/23/07: MA: 238 – a decrease (+18 sellers last period)

*EDU had a 1900% increase in institutional buyers during the case study in february. As you know, the stock moved from $36 to $60 after the case study and sponsorship increased another 64%.

*BIDU moved from $100 to $200 after the case study as institutional investors jumped in but they have been bailing as of late.

Think about this: RIMM has 841 current holders, AAPL has 2,436 and MSFT has 3,746.

Question #2 Answer:
I pinpoint stocks that have had substantial increases in shares held versus shares held previous period. This statistic will directly correlate to the value of shares bought and the value of shares sold. As long as more money is pouring into the stocks, I will keep it on my watch list for a potential buy. The contrary is true if I am looking for reason to sell. Anything above 25% is solid and anything above 100% is substantial (PRXI was my latest case study and the shares held went from 2.8M to 11.7M for a 318% gain).

Question #3 Answer:
Shares bought is very important because it is the true number behind the increase in institutional sponsorship. For example, institutional buyers may increase by 60% but the number of new shares bought may only increase by 10% (not a good sign). But, if the number of new shares bought is a lot stronger than shares sold, we have accumulation.
EDU had 6.3M shares bought and only 22k sold – ACCUMULATION! (286:1 ratio)
MA had 36.2M shares bought and 25.3M shares sold – ACCUMULATION (3:2 ratio)
BIDU has 8.63M shares bought and 4.58M shares sold – ACCUMULATION (2:1 ratio)

[Read more…]

Earnings and Sales Leaders

If this market has another leg up, these six stocks will continue to lead the way based on their impressive three year sales and earnings numbers.

I know they look extended and have come a long way but stocks that are accustomed to making new highs typically continue to make higher highs in a bull run. Remember, what seems high to one investor may still be low to another. Look for the stocks to establish support along moving averages or key areas prior to entering a position.

081407_numbers.PNG

Stocks are traded based on perception and if the smart money crowd perceives these stocks to go higher, they will jump in and push them higher. Besides, additional buys will only support the large cash positions that institutions have already established in these stocks throughout 2007. Take a look at the institutional numbers below to determine if smart money is pouring in or out.

As you can see, the latest numbers are telling us that institutional money has been leaving both CROX and BIDU while it has been pouring into PRXI, STP and ARD. Don’t use these statistics as your sole reason for buying or selling because they do lag the market but understand that they can confirm trends on the charts.

*All data from latest reporting periods*

Crocs (CROX) Institutional Analysis:
Total Institutions: 535
Money Market: 220
Mutual Fund: 304
Other: 11

Shares Held: 116.8 mil
Shares Held Previous Period: 118.3 mil

Shares Bought: 28.4 mil
Shares Sold: 29.9 mil
Value of Shares Bought: $1.43 Bil
Value of Shares Sold: $1.5 Bil

081407_crox_wkly.png

Baidu.com (BIDU) Institutional Analysis:
Total Institutions: 238
Money Market: 117
Mutual Fund: 119
Other: 2

Shares Held: 19.5 mil
Shares Held Previous Period: 22.0 mil

Shares Bought: 6.5 mil
Shares Sold: 9.0 mil
Value of Shares Bought: $1.36 Bil
Value of Shares Sold: $1.89 Bil

081407_bidu_wkly.png

Premier Exhibitions (PRXI) Institutional Analysis:
Total Institutions: 69
Money Market: 42
Mutual Fund: 26
Other: 1

Shares Held: 11.7 mil
Shares Held Previous Period: 2.8 mil

Shares Bought: 9.5 mil
Shares Sold: 0.6 mil
Value of Shares Bought: $160.2 Mil
Value of Shares Sold: $9.8 Mil

081407_prxi_wkly.png
[Read more…]

Fundamental Screens and Scans

I have been asked numerous times to shed some light on the actual fundamental screens I use to come up with the stocks I research on a daily basis. As promised in a post in April, How to Create a Successful Stock Watch List, I will now give you further detail on my fundamental screens.

As many of you know, my main tool is the Daily Graphs Custom Screen Wizard which is owned by William O’Neil & Co. Incorporated. You can get a trial subscription for 7-days on their main site but I would wait until they offer the trial for free (they do this several times per year). The screener does cost $45 per month which may sound high for one tool but it does the job for the stocks I am seeking.

I also use several screens though my brokerage account and the scan engine through stockcharts.com. It has a basic user interface and an advanced user interface for investors that can handle some basic programming. These screens locate stocks based on specific technical patterns which help me from time to time but I prefer fundamental screens to find the stocks I would like to view with my own eyes. I perform my own technical research as it allows me stay in-tune with the market on a daily and weekly basis. I can flow with the market by scanning hundreds of charts every night after the close.

Now I will disclose the top fundamental screens I use on the Custom Screen Wizard. EPS and RS ratings are based on a fundamental system created by IBD that I trust. To learn more about the EPS and RS ratings, please visit investors.com.

Please understand that I am always actively scanning these screens and some come-into favor and then fall-out of favor as time moves on. For example, the screen that locates quality stocks making new 52-week highs is best used when a market has just completed a bottom and a new bull-run or up-trend is starting to develop. This screen is less important near the end of a strong bull run as many of the stocks making new highs at this point in time are exhausted. We will see more failed breakout attempts, reversals and late stage bases so the odds are no longer in favor of this screen.

When scanning these screens, I will present the stocks in descending order starting with the day’s largest price change and occasionally starting with the day’s largest volume change versus 50-day moving average.

1. Quality Stocks within 10% of the 200-day Moving Average
The first screen I will present has been my most successful over the past six to twelve months and has been responsible for finding some of my best risk-to-reward setups:

  • Earnings Per Share (EPS) Rating: From 70 to 99
  • Relative Price Strength (RS) Rating: From 70 to 99
  • Current 50-Day Average Volume (1000): Greater than or equal to: 100
  • Current Price % Above or Below 200-Day Moving Average: From -5 to 10

2. Quality Stocks that are trading within 15% of 52-week Highs
This screen is great for finding high quality winners that are currently consolidating from recent highs and are now offering entry points for accumulating shares:

  • Earnings Per Share (EPS) Rating: From 60 to 99
  • Relative Price Strength (RS) Rating: From 60 to 99
  • Percentage price is below 52-Week High: From 1% to 15%
  • Current 50-Day Average Volume (1000): Greater than or equal to: 100
  • % Increase in Volume (Current Day) vs. 50-Day Average Volume: Greater than or equal to: 50

3. Institutional Sponsorship Increasing
This next screen looks for high quality stocks that have increasing institutional fund sponsorship from one quarter to the next. As you know, this is very important for any stocks I cover and then buy. Every case study on this blog includes detailed institutional sponsorship analysis.

  • Earnings Per Share (EPS) Rating: From 60 to 99
  • Relative Price Strength (RS) Rating: From 60 to 99
  • % of the number of Mutual Funds Owning for Current Quarter vs. Prior Quarter: Greater than or equal to: 10%
  • Stocks trading at new 52-Week High and Percentage price is below 52-Week High: From 0 to 15
  • Current 50-Day Average Volume (1000): Greater than or equal to: 100

[Read more…]

How to Create a Successful Stock Watch List

Follow these steps and you can create a powerful stock watch list in the matter of minutes to an hour each night. I work longer than that but it can be done in less time if need be. This watch list will generate opportunities for trend buying, swing trading and even shorter-term trading. I guess the occasional buy and hold investor could even benefit from this very simple procedure if they purchase at the right time.

I encourage all investors in all time frames to evaluate stocks for investment using both fundamental and technical analysis. A day trader and even a swing trader can get away with avoiding fundamental analysis but I highly recommend both methods of analysis for intermediate and longer term trend traders. Both tools are equally important in making serious decisions with your hard earned CASH!

If you wish to invest in stocks, treat it like a business, NOT A HOBBY. You need rules and you need to follow these rules or money WILL be LOST. Once proven rules have been established, they cannot be broke or you will lose money. Everyone loses money in investing but we must learn to cut losses quick and allow gains to develop. Small losses are acceptable because they teach us lessons that allow us to win big. Think of losses as part of doing business and focus on the long term success of the system and not each individual trade. As long as you have a positive expectancy, the winners and losers will equal out over time to make you consistently profitable.

Now to the watch list method:

  • Determine if overall market is in a specific trend (up, down or sideways).
  • Use a computerized screener to find stocks with superior fundamentals
  • Evaluate sister stocks or stocks within the same industry group (strength travels in groups so the probability of success rises when buying into a strong industry).
  • Study the technical aspects of the charts for each possible opportunity

Simple Fundamental Screener Criteria:
The criteria listed in this section can be used together or arranged in a variety of ways to generate multiple lists containing all possible opportunities. Get a feel for specific screens and determine which are the most successful during certain market conditions.

  • Increasing Earnings (current, past: quarterly, yearly and future estimates)
  • Increasing Sales (current, past: quarterly, yearly and future estimates)
  • Stocks making New Highs
  • Stocks within 15% of New Highs
  • Stocks within 10% of the 200-day moving average
  • Increasing Return on Equity (ROE)
  • Price/Earnings Growth (PEG) – Less than 1 is preferable
  • Accumulation/Distribution ratio
  • Up/Down Volume over past several months
  • Increasing Institutional Sponsorship

Simple Technical Analysis Scans (with your own eyes):

  • Study the one year weekly chart (preferably candlesticks)
  • Study the six month daily chart (preferably candlesticks)
  • Look for increasing accumulation days (stock up on above average volume)
  • Evaluate the Point & Figure chart for support and resistance levels
  • Look for basic chart patterns such as flat bases, cup bases, saucer bases, triangle breakouts, obvious trends along a moving average, etc…

That is all one needs to develop a quality list of opportunities night in and night out. Trading opportunities will appear once you see a particular stock make multiple screens on a consistent basis. This is the basic foundation I use to pinpoint my opportunities in the market and the general guidelines I used while running MSW.

I use the custom screen wizard from Daily Graphs (Investor’s Business Daily sister company) for my fundamental analysis because I love young growth stocks but many tools exist on the web. Some are free and some cost a pretty penny to use. My screener costs $45 per month which is nothing to me but maybe too much for others.

Please leave a comment on what screener you use and why. Leave a link to the screener that you use to give the site or business credit. I am very curious to hear what other trader use. As great as the wizard is for me, I am always looking to find something better.