Are we Nearing a Top?

The Big Picture examined an article titled, Why Market Optimists Say This Bull Has Legs, which made the front page of the Wall Street Journal Wednesday. Barry Ritholtz named his blog post “Uh-Oh: Front Page WSJ” Why Market Optimists Say This Bull Has Legs” and says: “In the past, that has operated as a bit of a warning sign that an intermediate top was nearing.”

I first read about this post from Trader Mike’s Recent Links which is an invaluable part of my routine in scanning top blog posts and financial stories of the day.

I am not sure if this WSJ article will signal a top but I tend to agree with Barry that this type of front page coverage has a history of signaling things to come. Experienced investors know that these articles don’t signal what they are speaking about but actually the exact opposite. A contrary view of front-page publishing; based on basic human nature.

Many of you may be familiar with the old theory commonly named “Magazine Cover Indicator” which typically signals that a company’s trend will be coming to an end or pause after the CEO appears on the front page. This also seems to be true when a company decides to build a new state-of-the-art corporate facility. In any event, let’s take a look at some technical analysis to see if we believe the market may be nearing a top or a brief pause.

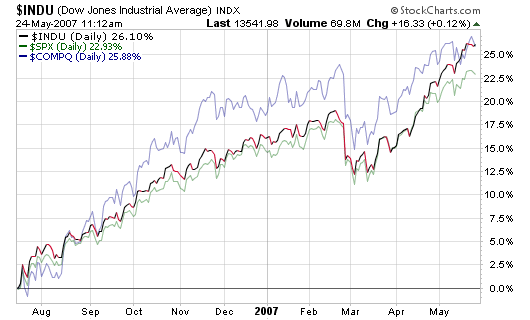
Looking at this first chart, we can see that the three major indexes are all up more than 20% in less than a year. I don’t see a sell signal by looking at this chart and actually like the fact that the market did take a breather in late February and March of 2007. I am not one to sell for the sake of selling but I do keep an eye on this performance chart to make sure the up-trend doesn’t extend too far without a natural pullback.

052407_market_perf.png

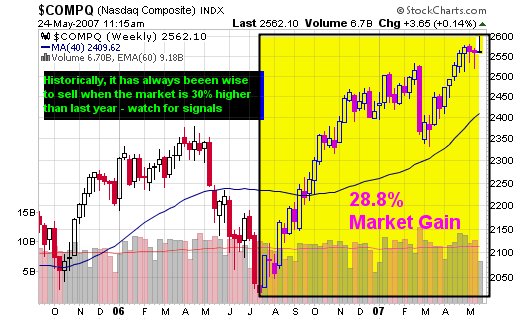
The second chart shows the NASDAQ reaching a 28% gain over a year ago which has signaled tops in the past. Eugene D. Brody, from Oppenheimer Capital, was quoted as saying: “Sell stocks whenever the market is 30% higher over a year ago”. Again, don’t sell for the sake of selling but watch for signals and major red flags. Maybe you should place physical stops instead of mental stops as we approach the quiet summer months.

052407_nas_per.png

Historically, June and July have been good months in pre-election years but August is usually a poor performing month according to the Stock Trader’s Almanac. Price and volume will be the ultimate barometer of the market’s condition so keep all of these things in mind but never act unless the market sends a true signal and/or confirms your beliefs.

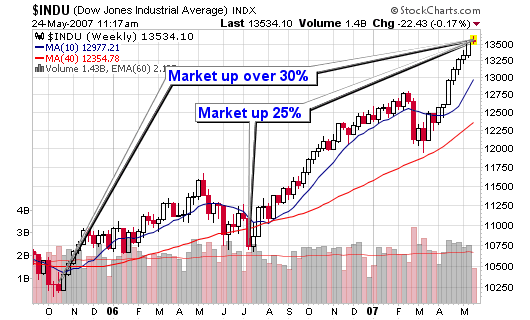
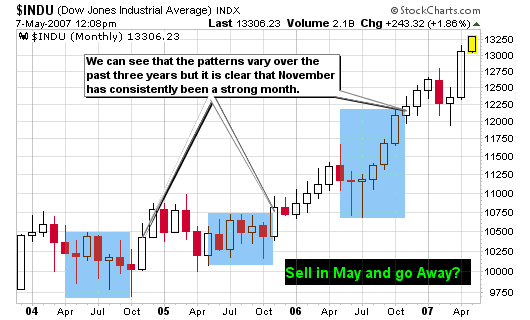
This final image displays the weekly chart for the Dow Jones Industrial Average which has gained 30% since October 2005 and 25% since last summer. We had a brief pause in the up-trend in the summer of 2006 and then again in March of 2007 but other than that, the index has been phenomenal while setting multiple all-time highs. We are now extended from both the 50-d moving average and the 200-d moving average so look to these areas as support or violation signals. The 200-d moving average carries more weight in determining if a trend is about to reverse.

052407_dow_per.png

Keep this quote in mind when looking for tops and bottoms:
“You try to be greedy when others are fearful, and fearful when others are geedy”
– Warren Buffett.

When the crowd gets greedy, the top is just around the corner and I don’t think we are there just yet! Ride the trend until it ends and don’t try to predict the top.

Annotated Stock Charts

All stocks, case studies and general market analysis that appear on this blog are entered into my public list of annotated charts over at Stockcharts.com. I update the annotations from week to week and sometimes from day to day for specific stocks. The list currently contains 83 real time charts with stocks I own, stocks I am researching, stocks I watch, stocks I have sold and stocks that interest me. It also contains charts for the major market indexes, commodity comparisons, currency comparisons, ticks, oil, gold, highs, lows, etc…


The best part is that these charts contain market data that is updated every 15 minutes from the stockcharts database or content provider. As the market data feeds into the charts, my annotations move along with time and clearly show how well the analysis is panning out (or poorly in some cases).

Feel free to visit my public stock charts list and definitely vote for it if you enjoy the work I am doing. I don’t get anything for the vote except maybe a smile for work well done!


Sell in May and Go Away

It seems that everyone is writing about this market phenomenon over the past week so I figure I will join the party but structure my article with statistics using the help of the Stock Trader’s Almanac written by Jeffery A. Hirsch and Yale Hirsch.

050707_sell_may.png

For the record, I am not selling just because the calendar says May. I just wanted to shed some light on the statistical data as it interests me

Worst six months of the year begin in May:
* All data is from the DJIA from 1950 to 2005

  • A $10,000 investment in the DJIA compounded to $544,323 for the period beginning in November through April over the past 56 years (termed the best six months)
  • Compare this to a $272 loss; yes I said loss for the same investment in May through October (termed the worst six months)
  • 44 of the 56 periods ended with a gain in the November through April period
  • Only 33 periods ended with a gain versus 23 losing periods in May through October
  • The average gain for the November through April period is 7.9% (56 yrs)
  • The average gain for May through October is 0.3% but the period did have an overall loss of $272 as mentioned above
  • The best six months gained 11,691.79 Dow points over the 56 yrs (data ends in 2005)
  • The worst six months actually lost 538.98 Dow points
  • [Read more…]

How to Create a Successful Stock Watch List

Follow these steps and you can create a powerful stock watch list in the matter of minutes to an hour each night. I work longer than that but it can be done in less time if need be. This watch list will generate opportunities for trend buying, swing trading and even shorter-term trading. I guess the occasional buy and hold investor could even benefit from this very simple procedure if they purchase at the right time.

I encourage all investors in all time frames to evaluate stocks for investment using both fundamental and technical analysis. A day trader and even a swing trader can get away with avoiding fundamental analysis but I highly recommend both methods of analysis for intermediate and longer term trend traders. Both tools are equally important in making serious decisions with your hard earned CASH!

If you wish to invest in stocks, treat it like a business, NOT A HOBBY. You need rules and you need to follow these rules or money WILL be LOST. Once proven rules have been established, they cannot be broke or you will lose money. Everyone loses money in investing but we must learn to cut losses quick and allow gains to develop. Small losses are acceptable because they teach us lessons that allow us to win big. Think of losses as part of doing business and focus on the long term success of the system and not each individual trade. As long as you have a positive expectancy, the winners and losers will equal out over time to make you consistently profitable.

Now to the watch list method:

  • Determine if overall market is in a specific trend (up, down or sideways).
  • Use a computerized screener to find stocks with superior fundamentals
  • Evaluate sister stocks or stocks within the same industry group (strength travels in groups so the probability of success rises when buying into a strong industry).
  • Study the technical aspects of the charts for each possible opportunity

Simple Fundamental Screener Criteria:
The criteria listed in this section can be used together or arranged in a variety of ways to generate multiple lists containing all possible opportunities. Get a feel for specific screens and determine which are the most successful during certain market conditions.

  • Increasing Earnings (current, past: quarterly, yearly and future estimates)
  • Increasing Sales (current, past: quarterly, yearly and future estimates)
  • Stocks making New Highs
  • Stocks within 15% of New Highs
  • Stocks within 10% of the 200-day moving average
  • Increasing Return on Equity (ROE)
  • Price/Earnings Growth (PEG) – Less than 1 is preferable
  • Accumulation/Distribution ratio
  • Up/Down Volume over past several months
  • Increasing Institutional Sponsorship

Simple Technical Analysis Scans (with your own eyes):

  • Study the one year weekly chart (preferably candlesticks)
  • Study the six month daily chart (preferably candlesticks)
  • Look for increasing accumulation days (stock up on above average volume)
  • Evaluate the Point & Figure chart for support and resistance levels
  • Look for basic chart patterns such as flat bases, cup bases, saucer bases, triangle breakouts, obvious trends along a moving average, etc…

That is all one needs to develop a quality list of opportunities night in and night out. Trading opportunities will appear once you see a particular stock make multiple screens on a consistent basis. This is the basic foundation I use to pinpoint my opportunities in the market and the general guidelines I used while running MSW.

I use the custom screen wizard from Daily Graphs (Investor’s Business Daily sister company) for my fundamental analysis because I love young growth stocks but many tools exist on the web. Some are free and some cost a pretty penny to use. My screener costs $45 per month which is nothing to me but maybe too much for others.

Please leave a comment on what screener you use and why. Leave a link to the screener that you use to give the site or business credit. I am very curious to hear what other trader use. As great as the wizard is for me, I am always looking to find something better.

Industry Analysis Using Investor’s Business Daily

Using industry analysis can play a very important role when looking for quality stocks to place into your portfolio or looking for laggards to sell. As we know, sister stocks travel in groups and 50% to 75% of a stock’s move can be attributed to the industry group itself. Therefore, it is a smart idea to study which groups are the strongest and which groups are falling out of favor.

Looking below, we can see that several Oil & Gas related industry groups are topping the charts along with metal related groups over the past week. They are the groups making the strongest advances over the past five trading days according to the data from IBD. I do gather the majority of my data from the electronic version of Investor’s Business Daily and have been a member since 2001.

When viewing the strongest one week and year-to-date moves, we can see that growth stocks are not leading the market as industrial related industries are making the best gains. Oil, metals, machinery, energy and trucks are populating my screens which tell me that the market is in defensive mode, not offensive and that is why much of my account is in cash (among other reasons).

Top 10 One Week Industry Moves:
Diversified Operations
Metal Ores – Gold/Silver
Oil & Gas – Field Servic
Oil & Gas – US Expl Pro
Utility – Electric Power
Metal Prds – Fasteners
Comml Svcs – Printing
Tobacco
Food – Misc Preparation
Oil & Gas – Drilling

Top 10 Year-to-Date (YTD) Industry Moves:
Oil & Gas – Machinery
Energy – Other
Auto/Truck – Original Eqp
Machinery – Farm
Oil & Gas – US Integrat
Machinery – Constr/Mining
Trucks & Parts – Hvy D
Comml Svcs – Schools
Machinery – Tools & Re
Elec – Parts Distributors

It is also important to follow the weaker industries so you can determine the overall market trends and trade according to the stocks in favor. Several hi-tech growth industries have fallen to the bottom of the pile over the past week and for the year. Multiple computer and internet related industries are leading the market to weakness as retail and finance are not far behind. Of course I can’t forget to mention that the residential building industry has lost its recent steam but seems to be gaining some support near multi-year lows. This could be a buying opportunity area for longer term value investors if support holds.

Bottom 10 One Week Industry Moves:
Bldg – Resident/Comml
Soap & Clng Preparat
Retail – Consumer Elec
Internet – Content
Retail/Whlsle – Jewelry
Retail – Leisure Products
Finance – Investment Bkrs
Telecom – Equipment
Leisure – Hotels & Mot
Bldg – A/C & Heating

Bottom 10 Year-to-Date (YTD) Industry Moves:
Computer – Peripheral Eqp
Computer Sftwr – Desktop
Finance – Investment Mgmt
Retail/Whlsle – Cmptr/Cell
Bldg – Resident/Comml
Finance – Investment Bkrs
Retail – Consumer Elec
Retail – Leisure Products
Medical – Ethical Drugs
Computer-Manufacturers