Weekly Market Review

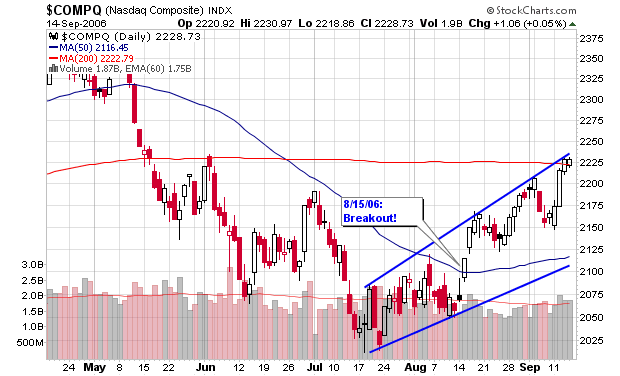
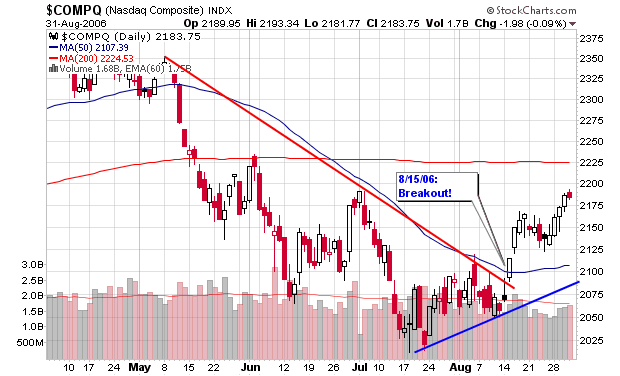
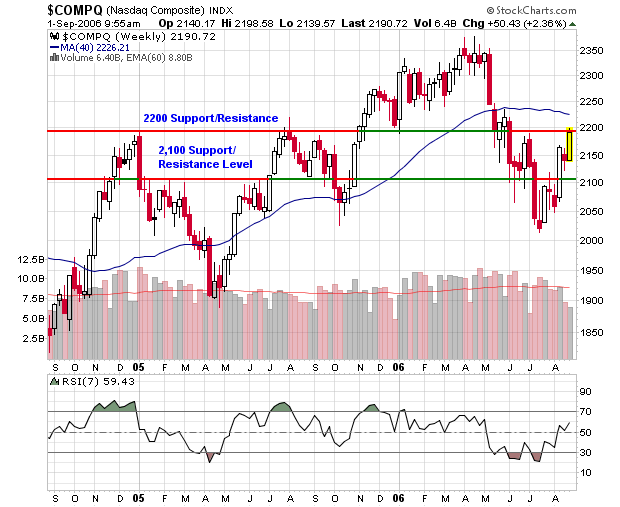
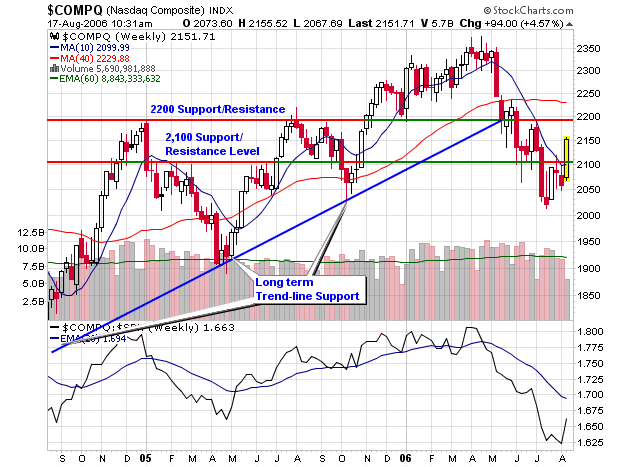
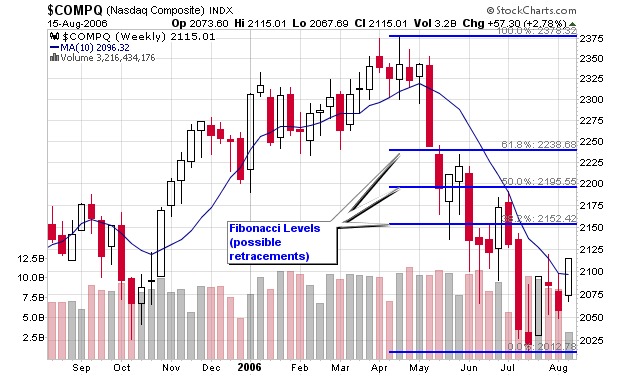
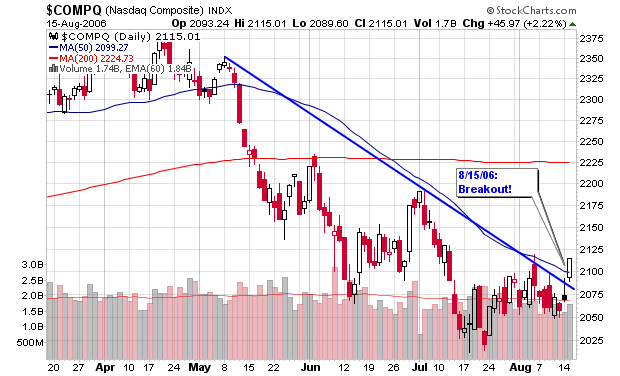
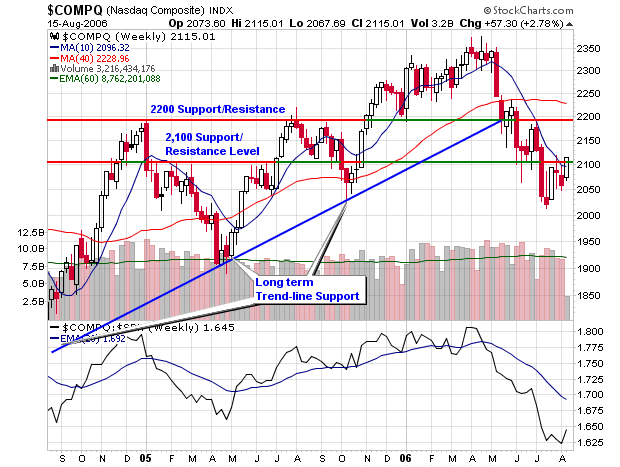
The NASDAQ is up almost 3% for the week as it has traveled from the 38.2% retracement level, thru the 50% retracement level to slightly below the 61.8% level. The highest retracement level is not important as I have been focused more on the 200-day moving average and the support/resistance level at 2,200. The NASDAQ is trading above the 200-d m.a. for the first time since May hence the statement “Sell in May and go Away”. I have been discussing and studying the markets around that statement strategy for three years now. It’s been very accurate since the bubble burst in 2000.

Looking at a daily chart, we can see the index is now trading between an upper and lower channel range with current prices touching the upper side. A move above this level will alert me that a short opportunity may become possible as the index would be too extended. Since today is options expiration day, I wouldn’t advise too much intraday activity.

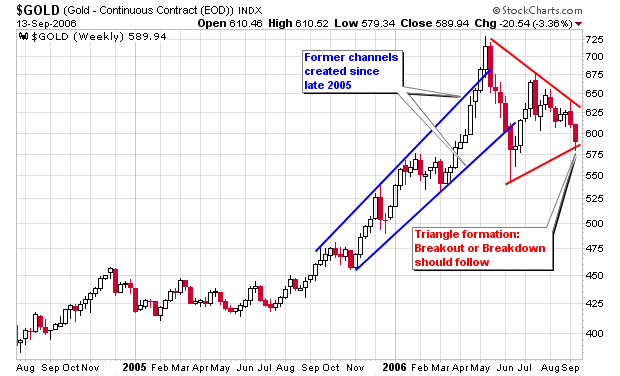
Gold continuous contracts are forming a triangle pattern as noted on the chart with red lines. The former trading range between $600 and $650 no longer applies as we are now below $600 for the first time in months. This will be an interesting play but don’t jump the gun and enter before a signal to either side.

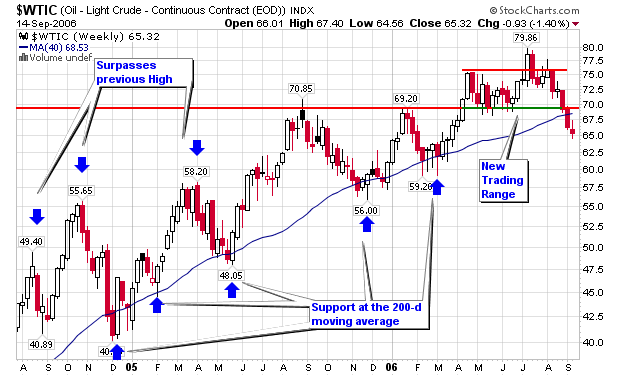
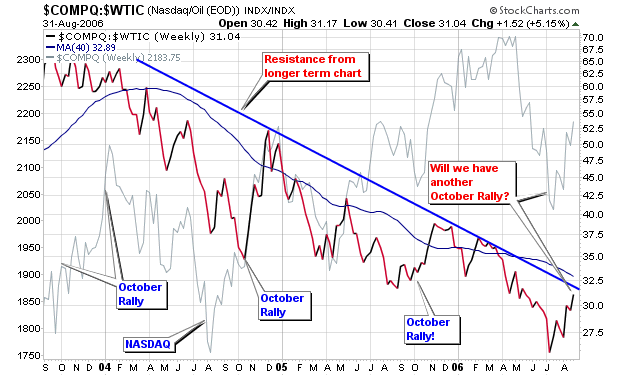
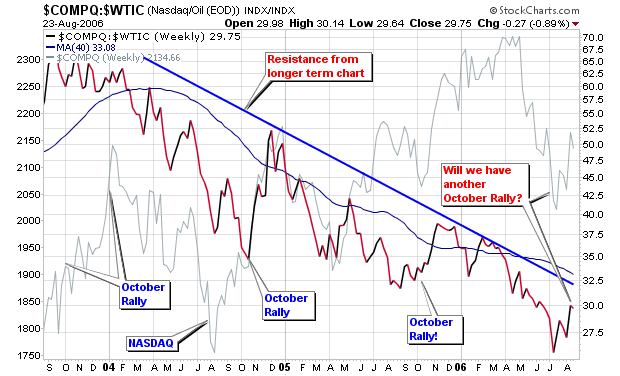
Crude oil contracts are trading at their lowest levels since March and are in a clear downtrend with 17 of the last 27 days giving us a loss. If you look at the weekly chart, you can see that Crude has violated the 200-d m.a. in the past and recovered so I am not sure if it is ready to turn over yet. I don’t suggest a long position until the contracts can recover their 200-d m.a. and the former support line which now acts as resistance. It is very important to wait for the signal before entering a trade because the market doesn’t follow what you “think may happen”. Let the market show you what it wants to do and then trade what it is saying.

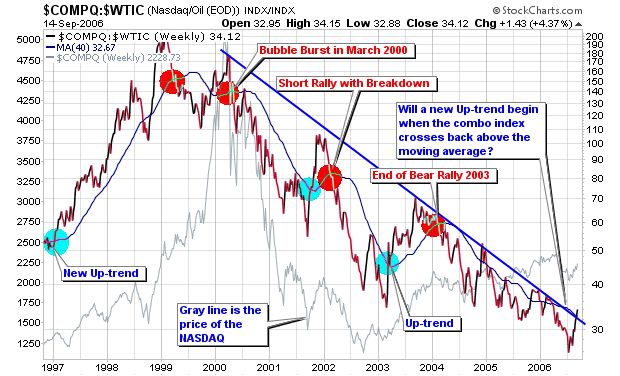
Due to the weakness in crude, the NASDAQ-Crude combo index is now above the long term down trend line for the first time in years. We have rallied several times over the past five years when October shows its face and this year could be similar. I don’t know if this is the start to a further rally or just another head fake in 2006. This combo index is purely a secondary indicator so don’t make any decisions based solely from this chart. This chart is here to confirm your beliefs from other front line indicators such as price and volume and that’s it.

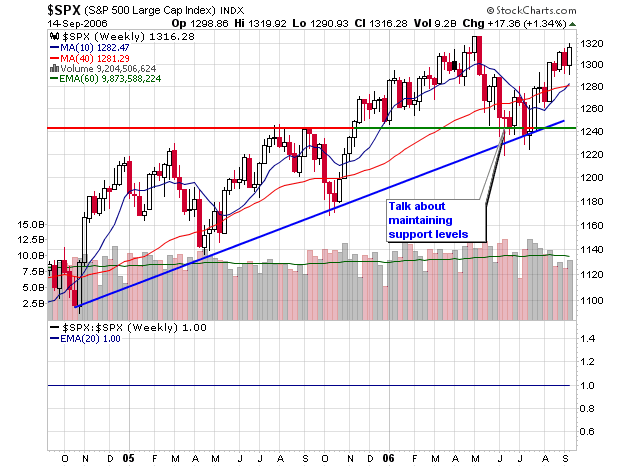
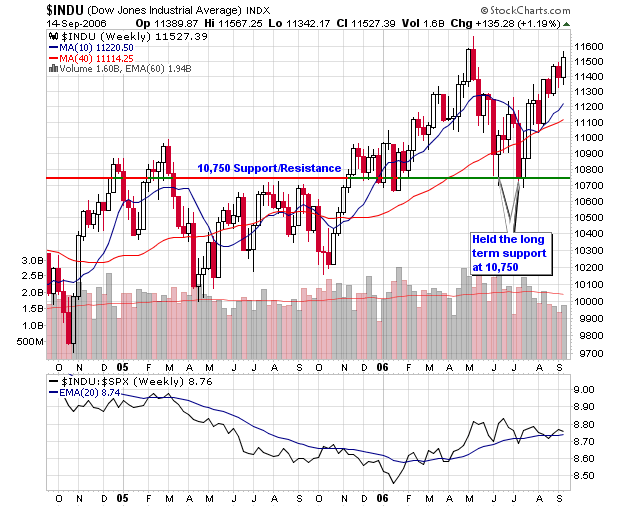
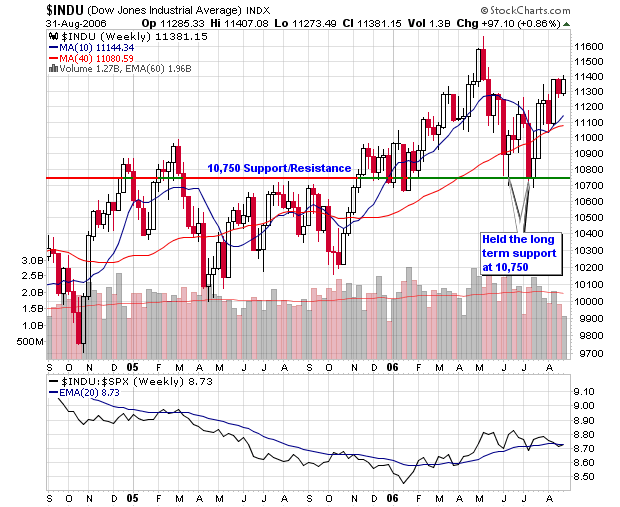
Moving on to the DOW and S&P 500, we can see clear cup shaped bases that are currently building the right side. The S&P 500 base is a bit more rounded than the DOW as I would like to see handle formation before a move to new highs. I know the market doesn’t care what I want but both indexes are up about 10% since their bottoms from earlier in the year so we need to shake out the weak holders before making new highs.

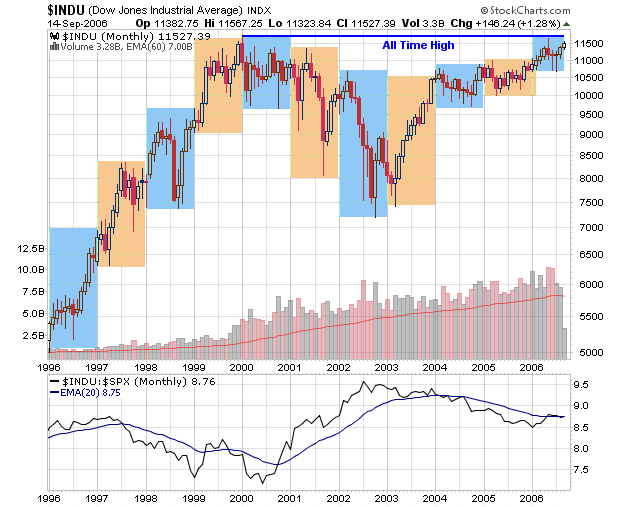
Speaking of highs, the DOW can attempt to make an all-time high if it continues to push north. If we really want to dissect this chart, we can say that a seven year cup shaped base has formed as we are about to close the right side of that pattern and possibly form a handle. I don’t typically look at bases in yearly terms but I couldn’t ignore what I see.

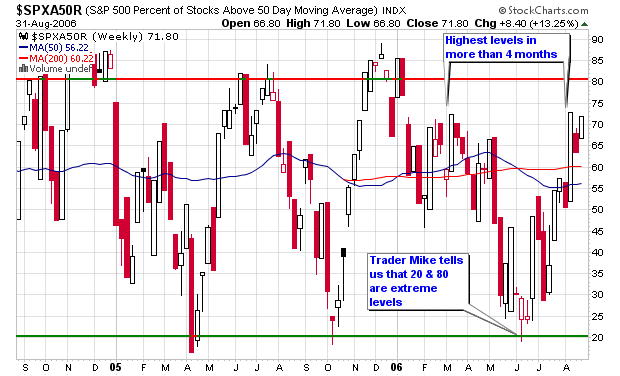
Finally, all of this means nothing to me if the New High – New Low (NH-NL) ratio can’t confirm the action. As a CANSLIM trend trader, I am not prepared to make any long commitments until I can see the NH-NL ratio consistently reach 500 news highs per day and individual leaders making new highs on above average volume. Some individual stocks are acting this way but many more are still reversing after their false breakouts.

Trust me, when the NH-NL ratio starts to record 500-800+ new highs per day, we will be well on our way to the next sustainable bull market. Until then, play the short term moves and always employ solid money management techniques and always sell losses short!

Have a great weekend,
Piranha

Current Market Temperature

The NASDAQ is following the Fibonacci plan of action to a ‘T’! It retraced to the 38.2% level and then consolidated for a week as I noted and is now hitting resistance near the 50% retracement level. It wasn’t really a question of if but when the NASDAQ would reach to the 50% retracement level. The index faces a decision once again: to consolidate one more time before attempting to move to the next retracement level or pull back and gain some support near the 50-d moving average. I still suspect a pull-back to the 50-d m.a. as the index still needs to fill a gap-down in that area (see the NASDAQ daily chart provided). I will not guess what the index will do and will only trade the signals.

Looking at the daily chart of the NASDAQ, we can see that the index is now trending higher and has been since it started to retrace. Volume has been weak but that can be attributed to end of summer conditions. Volume should start to pour back into the market as September carries on and institutional investors return from vacation.

A closer look at the weekly chart will show you that the NASDAQ is now testing long term resistance just below the 2,200 level (very similar to the Fibonacci retracement level of 50%). Again, volume is weak so I am not sure if the index will have the power to overtake this area but I will watch to see if a trading range forms between 2,100 and 2,200. Look back exactly one year to see what I am taking about.

The percentage of stocks making new highs on the S&P 500 is still near four month highs so I am not concerned about any weakening of the potential individual leaders. The NH-NL ratio has been positive for the most part but not overwhelming with strength. As long as it stays positive, we don’t have too much worry about.

The Gold chart is similar to the NASDAQ retracements as I wanted to point out how the commodity is using the Fibonacci levels as support and resistance. Currently, the commodity is using the 38.2% retracement level as support as it trades in a sideways range between $600 and $650 with larger support below near the 200-d m.a. Notice how Gold reached the third retracement level and then sold off to consolidate into its current range. The move could be considered textbook to some.

Both the DOW and S&P 500 are forming cup shaped patterns with support below at their respective moving averages. I am interested to see what will happen as they approach all-time highs (if they can in the next couple of months). When they approach these highs, study the RSI chart to see if the buying is coming in with strength. As a follower of CANSLIM, I would love to see both indexes form a cup with handle pattern and then break-out with powerful volume along with individual leaders. That type of action could start a rally.

Finally, I will focus on the crude oil contracts as we can see that they are testing support near $70 with more support at the 200-d m.a. (slightly higher than $68). I would not become concerned with crude oil until it sold below the 200-d m.a. on heavy volume which could and most likely would propel stocks in the opposite direction. The combination index I have uploaded shows the relationship between crude oil and the NASDAQ and the current short term trend is higher while the longer term trend is still lower.

Enjoy and click on each chart for a larger view!
Piranha

Will the NASDAQ be 50% higher in 6-12 months?

I posted up a chart looking at the relationship between the NASDAQ and crude oil contracts a couple months back in an entry titled “Can the NASDAQ – Crude Oil Index predict Bulls & Bears”.

The combo index highlighted the relationship of the two indexes and actually told us on a higher level when and where the market was making rallies or starting major down trends over the past 10 years. Visit the link above for a further description of the actual combo index.

As this year moves on, I have noticed that the combo index continues to reach new multi-year lows while traveling below its 200-d moving average. Recently, it started to move north but still lives beneath the moving average and long term trend-line or resistance. I am still wondering if this index is useful and if it can confirm a sustainable rally if it crosses back above the 200-d m.a. and multi-year resistance line.

While reviewing the three year chart, I noticed the spikes in October and was wondering if it will do the same this year since the action is starting to resemble previous years (post bubble burst era). Whatever the case, it will be very interesting to see many indicators move to the positive side simultaneously all confirming a possible rally towards the end of this year. The Stock Trader’s almanac states that mid-term election year lows usually peak 50% higher in the following 6-12 months. We are now in a mid-term election year and several indicators look to be hitting bottoms with an urge to move higher.

So I ask:
Will the NASDAQ be 50% higher in six to twelve month from this year’s bottom?

Only time will tell and I will not know the answer until my most important indicators give me the green light signal to buy heavy on the long side!

Piranha

NASDAQ creating Trading Opportunities

The NASDAQ has reached level one (38.2%) of the Fibonacci retracements with a 4.57% advance this week. The index may take a breather since we have made gains the past three days with a gap-up yesterday. However, if the strength in the market is true, the 50% retracement level should be the next target for the NASDAQ after a slight breather.

The 50% retracement level (2,195) is where I can see the index hitting stronger resistance since several factors come into play. The first is the actual Fibonacci retracement itself, the former breakdown from late May to early June and the longer term resistance and support line near 2,200 which dates back to the start of 2005.

If resistance is met, a short term short play may be in store for the NASDAQ; take a look at the QQQQ for a possible option play. You could also play the SPY as it is moving in stride with the NASDAQ this week.

Finally, the percentage of stocks above the 50-d m.a. on the S&P 500 have reached their highest levels in more than four months as indicated on the chart below. This market move is showing strength as several secondary indicators are confirming such as the stocks above their 50-d m.a., the NH-NL ratio and the action among individual stocks.

Keep in mind that September is the poorest performing month in recent history so a reversal is not out of the question. Protect your positions and don’t get emotional with this recent burst of strength. It can turn on a dime and you must be ready to act. Remember, the NASDAQ is still trading below its 200-day moving average (a negative in my book for a sustainable rally).

Piranha

NASDAQ looking for Retracements

Several things happened with the NASDAQ during the trading day on Tuesday:

The NASDAQ clearly broke above the down-trend line noted on the chart I have featured several times on this blog while also recovering the 50-d m.a. and the 2,100 resistance level. I spoke at length this past weekend on my weekly analysis over at MSW about these resistance levels and I made an in-depth argument as to why the NASDAQ can reach the retracement levels or re-visit lows set back near 1,900.

Volume was higher on Tuesday than Monday’s action but still light compared to the average since we are in the middle of August (summer volume is always weak).

The new highs topped new lows on Tuesday as most of the positive news could be attributed to the inflation report (the first positive day in more than a week).

Here is some of my commentary from the MSW weekly analysis from this past Sunday:
From 8/13/06:
“Now, if the NASDAQ were to breakout above all three of these levels (speaking about the down-trend line, the 50-d m.a. and the 2,100 resistance level) and individual stocks confirmed, it would be a major short term buy signal, one that I am watching very closely. On the downside; if the NASDAQ were to make a weekly close below the previous low near 2,020, we could be visiting areas between 1,900 and 2,000.

Where do I see this?

Take a look at the weekly of the NASDAQ and the next level of support near 1,900, set back in April 2005. September is the weakest month of trading for the market over the past decade so I would not be surprised to see this level revisited with a close below 2,000. But…

Using 1,900 as the low level of the most recent advance of 2,350 as the peak, we have retracement levels of 2,178, 2,125 and 2,071. With the NASDAQ closing at 2,057 this week and an intra-week low of 2,012 a few weeks back we might expect a rally as a temporary bottom may be developing since all three retracement levels have been met and then some. The Fibonacci retracements suggest that the market is over-sold and could have a short term bounce.

Using 2,378 at the high value and 2,012 as the low value on the daily chart, we can now see that a possible positive retracement can take place to any these three levels:
38.2%: 2,151
50%: 2,195
61.8%: 2,238

Based on recent NASDAQ action, I could see the index reaching the 50% retracement since the most recent peak was set at 2,190 at the end of June and early July (this peak materialized at the 50-d m.a. and the down-trend line found using the daily chart).

I hope I haven’t confused you yet! To recap, I have talked about a possible drop to 1,900 and a possible retracement rally between 2,151 and 2,238. I can’t tell you which one is more likely to happen but that is not my job. My job is to point out possible scenarios and give you an adequate chance to capitalize on the move and be prepared for the possible move. Now that you know what type of moves can happen, you can get yourself ready for possible trades that will allow you to make a profit in either direction (only if you are comfortable trading in both directions). This is how traders make money; they assess the situation and then look for possible trades that can benefit in either direction and they do all of this during their off hours (not during the trading day). Since the work will be done prior to the move, your setups and triggers will be set prior to the action so you will be able to make an unemotional decision in the “heat-of-the-action”.”

MSW members were privy to this market analysis prior to Tuesday’s move!
With yesterday’s move, we will now see if the first retracement level will be hit and then the possibility of a run to the 50% retracement level (see the attached chart).

Piranha