Déjà vu on the NASDAQ?

As I was researching my archives on MSW (the archives from 2004 and 2005 are open to everyone) I found some interesting data that correlates the NASDAQ in 2004 and 2006. So far in 2006, we have had 15 down weeks and 14 up weeks. At this time in 2004, we had 19 down weeks and 10 up weeks and the NASDAQ was at a nine month low (very similar to now as we are near 10 month lows). In 2004, my daily and weekly screens started to turn south on May 9th; in 2006, they started to turn south on May 15th (about the same time).

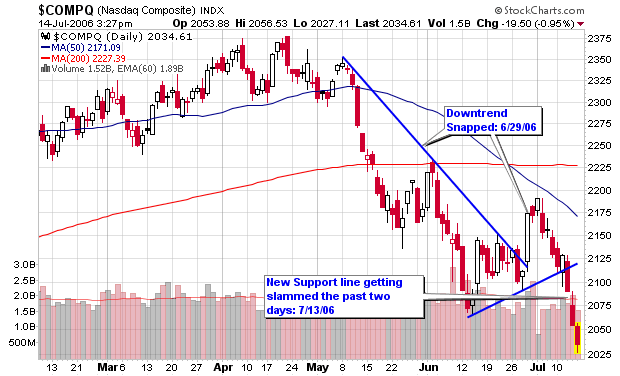
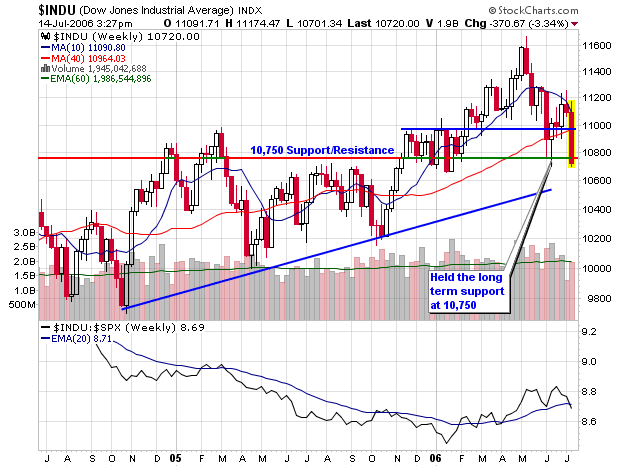
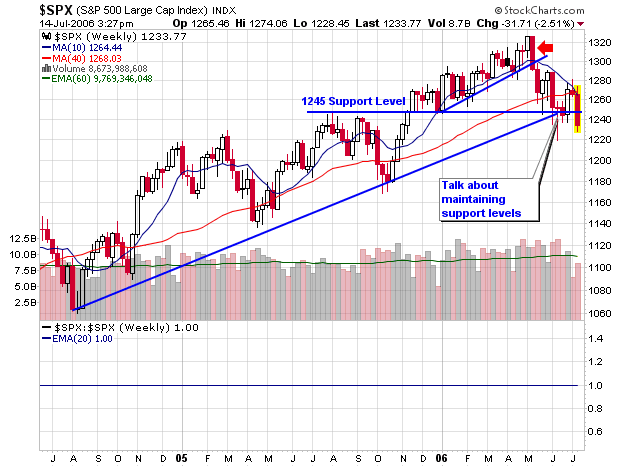
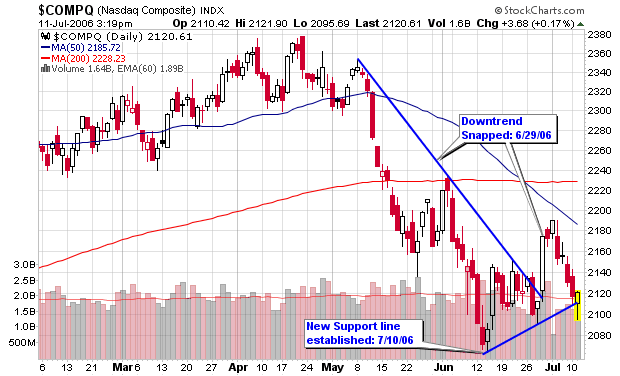
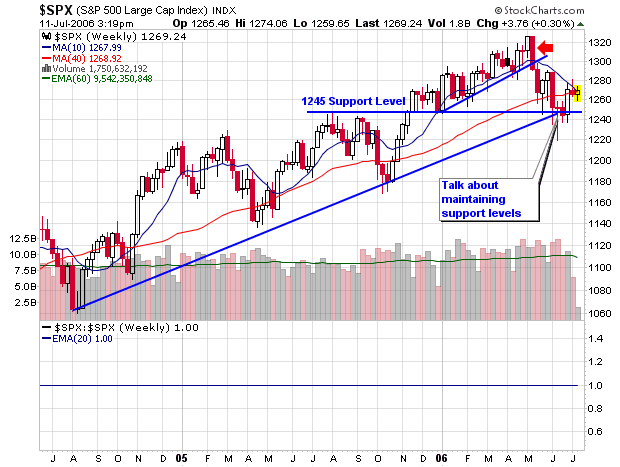
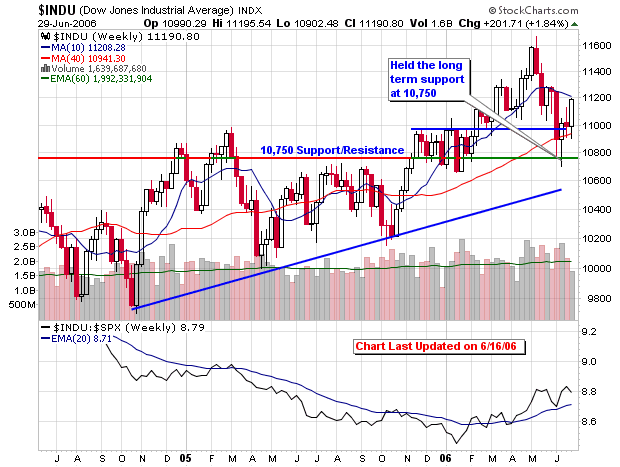
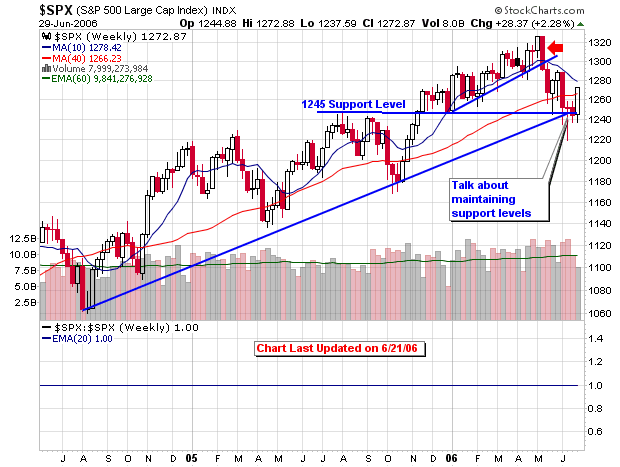
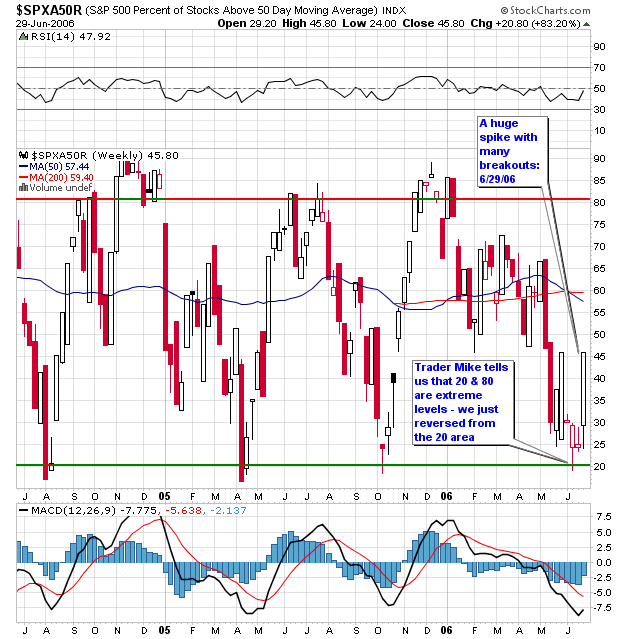
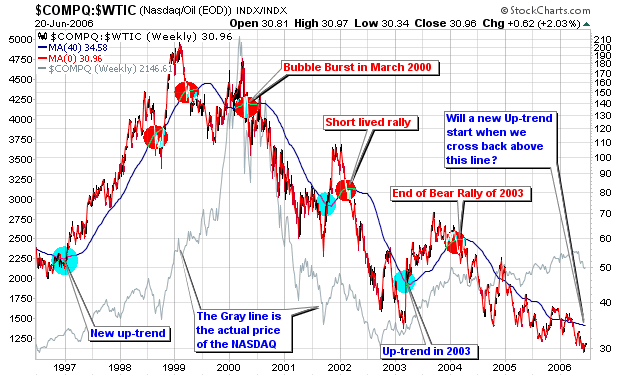
If you look at the two charts presented in this blog entry, you will notice how the market started to weaken in May and June and with a bottom near the end of July into early August. This summer is not over but I am wondering if the pattern will turn out to be similar to the one from 2004. The old saying: “sell in May and go away” has held up over the past couple of years with opportunities presenting themselves during the fall (towards the end of October).

Several of things I was saying back in 2004 are very similar to what I have been saying over the past two months. The similarities are amazing and the current NASDAQ chart may be forming a pattern that could take a similar route as it did in August of 2004. Only time will tell but history repeats and traders are always learning from history.

NOTE: when I say history repeats; I am not saying that it repeats exactly but the charts do resemble similar formations and seasoned traders and investors can capitalize on these situations.

Here is my exact analysis from July 2004, very similar to things I am saying today (2 years later).

“WEEKLY OVERVIEW of 7/19/04 to 7/23/04:

I am starting to sound like a broken record. The Dow was down for the 5th consecutive week. The NASDAQ is now at a nine month low.

Quote from IBD regarding the NASDAQ:
“Out of 29 weeks of trade this year, excluding the week ended Jan. 2, 19 have been down.”

I ran my screens this past week with a few stocks making some daily cut offs – barely. When I ran my final weekly screens last night, I came up empty. Not one possible candidate that legitimately makes my watch list. I must scratch my head when I see people listing dozens of stocks for potential buys in this type of environment.

Anyway, I have my own system and that is all I can talk about right now and this system is telling me to be patient, be very patient. Every red flag has been raised over the past 3-4 months.

Anyone that has followed my screens would have noticed that things were going south when I stopped posting individual stock lists after May 9th. How could I, quality stocks were not around. I would be doing an injustice to the people that follow my screens if I just posted any old crap for the sake of posting.

Now, let’s be patient – patience is one of the most sacred virtues of a stock market investor. Jesse Livermore once said: “It’s not your thinking that makes you money, it’s your sitting”.

Here are some insight about market corrections:
Market corrections are healthy, allowing it to breathe. Corrections allow stocks to shake out weak holders and allow stocks to form proper bases. Corrections allow stocks to resemble their actual value more closely. Market corrections and flat markets allow intelligent investors to study conditions carefully while they sit on the sideline patiently awaiting the defining trend. Money is made on the big moves, not the minor day to day moves. Corrections allow big moves to establish themselves.

During bear markets or general market corrections, it is essential to keep up your watch list as many future high flyers are building bases during these times. Stocks that correct the least and sport the highest relative strength lines tend to be the leaders of the next bull market. Take note of all stocks that are base building during corrections, a cup with handle or flat base are the most popular.

How can you spot a correction or bear market on the horizon
• The major indexes will advance on below average volume.
• Stocks making new 52-week highs will be limited.
• Stocks making new lows will increase.
• Major indexes will fall below the 50-day MA and/or the 200-day MA.
• Index averages will start to under perform. Relative strength lines will head south.
• Major publications will tout hot stocks at key market reversals (market tops).
• Smart money will bail in huge volume. Down days on excessive volume above average.

NO STOCKS LISTED THIS WEEK, REFER TO PREVIOUS WEEKS”
-7/26/04

Just a note: I didn’t add any new stocks to the MSW index last week (7/26/06)!

Piranha

A Picture is Worth a Thousand Words

Need I say more?

Test Buys are starting to Pull-Back

Even though I have placed several test buys over the past few weeks, I am starting to see some of the breakouts pullback and possibly breakdown. I will not hesitate to cut these positions and move back to cash as this rally may be a false move especially since it confirmed well after the seventh day (original CANSLIM rules).

We’ve logged two consecutive negative days for the NH-NL ratio and are on target for a third today. Looking at the NASDAQ daily chart, we can see that the index has formed a new short term up-trending support line with today qualifying as the third touch. We slipped below the line intraday (briefly) but have managed to pull back above the line (slightly) in late afternoon trading.

Looking at the NASDAQ weekly chart, we see that the longer term trend is holding support above 2,100 for the past seven weeks as a new range is starting to form between 2,100 and 2,200 (below both major moving averages). Relative strength for the NASDAQ has dipped to a new 52-week low as seen on the weekly chart.

The S&P 500 and DOW are trading near recent support levels but are struggling to climb above their respective 50-d moving averages. The S&P 500 is holding the 1,245 support level and is still above the up-trending support line dating back to 2004 but the short term outlook is not anything to write home about.

Finally, looking at crude oil, we can see that a 13-week trading range has developed between $70 and $76 with both numbers acting as support and resistance. I am still looking for a break below $70 in order for the market to gain a sustainable rally but it is not happening. Even if crude breaks the current trading range, I see the longer term moving average (40-week or 200-day) giving support lower as it has over the past several years.

We will need to continue to grind out small gains based on quick movements as the longer term trends are still sideways with volatile swings from month to month.

Piranha

Mid-Year Rally?

Thursday’s move was powerful and it was powerful on several levels. I say this because the new highs list on the daily screen is the strongest I have seen since the end of March. The MSW Index stocks were simply amazing and have a 5% gain for the week (a total of 14 stocks – 8 of them are up more than 6% with two in double digits). Several stocks we have been following together over the past several weeks broke out or moved to new highs, many on above average volume – a sure sign of accumulation. The Fed raised the rate by 25 basis points to 5.25%, the 17th in the past two years but also gave investors an idea that they may slow the aggressive hikes in the future. Remember, the market typically prices-in future news six months in advance so we may be starting to see the positive move we want six months before the Fed stops raising rates. HOWEVER, I will not base that assumption on one day of strong moves with strong volume but everything starts somewhere and today is that kind of day.

The NASDAQ was up 3% on volume 35% larger than yesterday while the DOW was up 2% on volume 26% larger than yesterday (the first major accumulation day in weeks, if not months). We never undercut the previous low set before the attempted rally so technically this can be a follow-through even though I marked it dead on Wednesday. I will now look for an additional follow-up move to confirm this move but the stop sign has been lifted for buying stocks. If you decide to start placing positions, please continue to use caution and strict selling rules so you don’t get whipsawed and lose a large amount of money in a short period of time. Use the proper position sizing techniques based on the size of your portfolios. Today was the largest daily gain for the DOW since April 2005, the largest for the NASDAQ since March 2004 and the largest for the S&P 500 since October 2003.

Another solid sign was the NH-NL ratio which recorded its first positive ratio (186-126) in 19 trading days (31 of the past 33 days have been negative).

So, how do we know if this is a true rally? The next step is to watch the leading stocks and start to place some test buys (about 1/3rd your typical position size) and see what happens. If you make money, the rally is telling you something, if your positions turn against you, it may be another bluff. I don’t know the answer but I will soon enough as I will be placing a few test buys. Depending on the action in the market tomorrow, I could be writing a great weekly analysis and updated MSW Index. Days like today are fun and I have been waiting for something like this to happen for a long time. I go on vacation Saturday but I am definitely bringing my laptop so I am able to watch the market and make moves next week.

As the Stock Trader’s Almanac states: the NASDAQ’s mid-year rally from the end of June through mid-July is strongest. The NASDAQ has been averaging a 3% gain since 1987 from the end of June to the second week of July versus 0.1% for the entire month of July. History also states that the gains over the next four months will be solid if July provides us with huge gains. In any event, continue to follow the price and volume of the indexes, the NH-NL ratio and individual market leaders.

Piranha

Can the NASDAQ – Crude Oil Index predict Bulls & Bears

As many of you know, I have had a lot of time on my hands as the market has been trading in volatile patterns with a downward bias. The majority of my money has been parked on the sideline since mid-May with the exception of a few open option contracts (longer term plays). I have not made a trade in five weeks since the start of my vacation in late May and I have become very bored. It’s been tough writing nightly market analysis but I am doing my best to locate possible short setups, consistently monitor the mechanical screen and follow the few market leaders (I prefer to call them stocks with the best RS ratings and charts as no true leaders exist right now).

Using this free time, I have been comparing certain market indexes with other benchmarks that I have been following over the past 6-12 months. Two of these include the NASDAQ and crude oil (light contracts). Two charts are loaded to this blog post:

  • The first chart is a combination index that I created myself using Stockcharts.com advanced tools. It combines the average close of both the NASDAQ and crude oil contracts over the past 10 years with a 200-d moving average. As you can see, the progression of this chart has called every major up-trend and downtrend before it was about to happen. The gray line on the chart represents the actual close of the NASDAQ index over the past 10 years (this line varies from the combo index). The only major divergence between the combo index I created and the actual price of the NASDAQ is during the past 18 months (since crude has gone wild). The combo index continues to trade downward as the NASDAQ trades sideways to slightly upward.
  • The second chart compares the action among the NASDAQ and crude oil over the past 10 years without any special combination effect. As you can see here, both entities have been trending higher over the past 18 months. This is very different from the combo index in the first chart.

So how would I use this combo index?

It is a long term outlook index that seems qualified and prepared to call the next major up-trend for the NASDAQ. To do this, the combo line must cross back above the 200-d moving average with strength and consistency. It has not stayed above the 200-d m.a. for long periods of time since 2003, the most recent “up-trending bullish market”. Prior to 2003, we have not seen a true bull market up-trend with this combo index above the 200-d m.a. since 1997-1999. From mid 2000 on, the combo index has spent much of its time below the 200-d m.a. and we all know how the market has behaved since March 2000.

So, to answer a question I received about a recent comment on a blog post: yes, I do believe that crude oil must cool off before we can sustain a major bull rally and this combo index may prove my theory correct if it continues to trade accordingly. But then again, it is only a theory and I am not into predictions.

Enjoy the combo index.