Reviewing the Market Charts

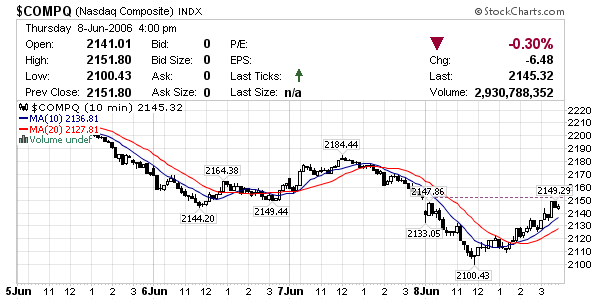
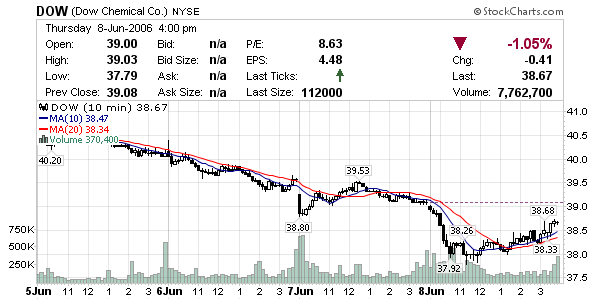
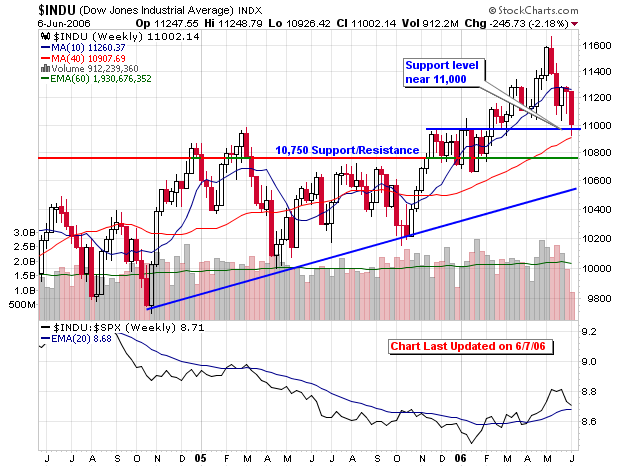
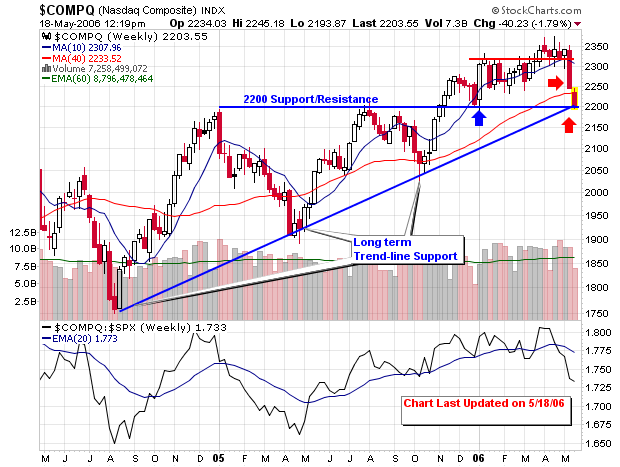
The DOW was back above 11,000 with a 1.8% gain on volume that was close to yesterday’s average while the NASDAQ was up 2.8% on volume 6% larger than yesterday. Advancers led decliners by a 4-to-1 ratio on the NASDAQ as many familiar stocks joined the party.

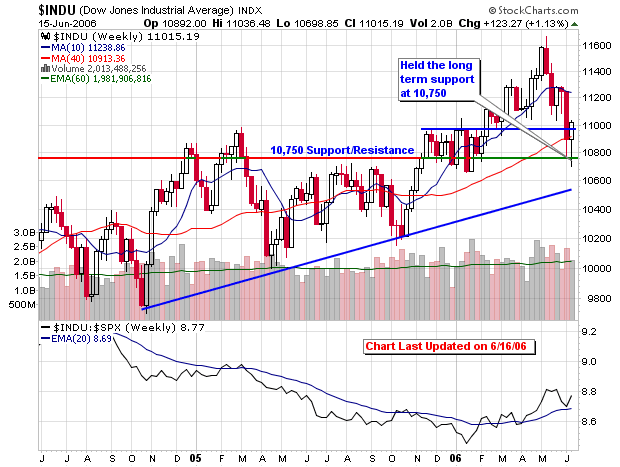
This was the best gain for the NASDAQ since March 25, 2004, well before the official start of MSW, although I was running these screens on several internet forums. It was also the first back-to-back triple digit gain for the DOW in 18 months as all 30 DOW stocks ended higher (not that we follow these blue chips).

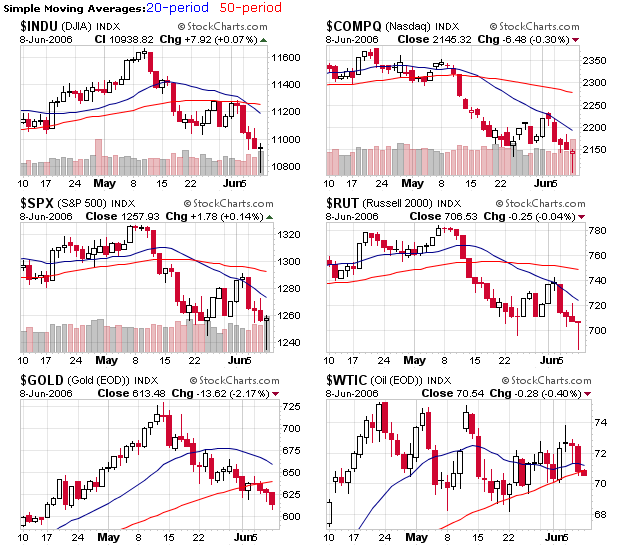
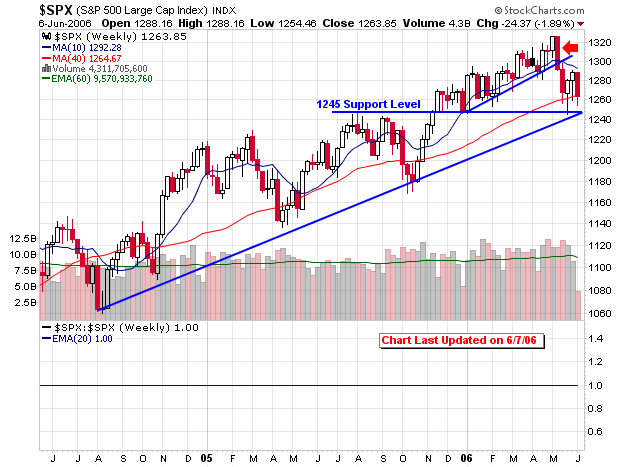
The S&P 500 gained 26.12 points for its best one day gain since Mach 17, 2003 when it gained just under 30 points. The gains were solid but the volume was lacking for an all-out accumulation day as the NH-NL ratio finally subsided a bit with a final tally of 57-124 (still negative but looks much better than the past week).

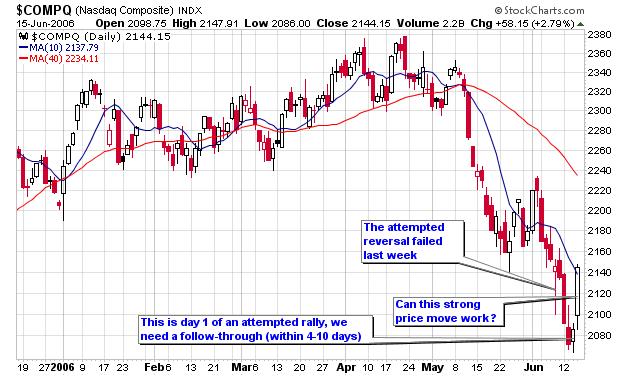
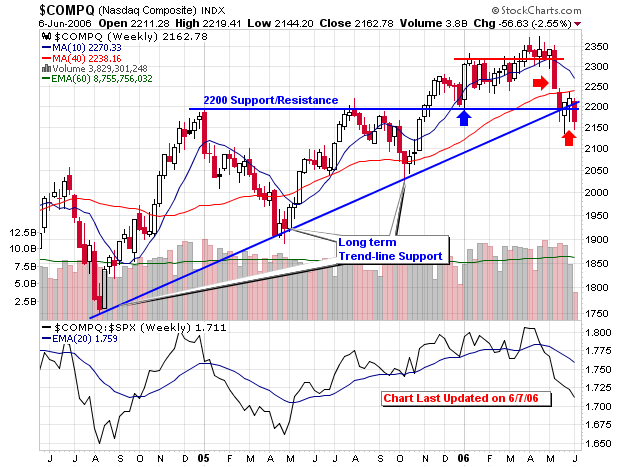
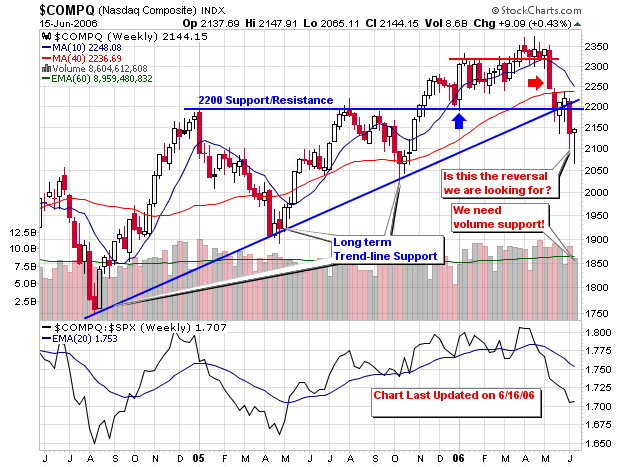
If you are wondering about a rally, today was the second day of a newly attempted rally with a follow-through targeted for Monday thru Friday of next week. The rally count reset after we hit a new low, lower than the previous rally attempt. I told you that July was the only bullish month of the summer so I wouldn’t be surprised to see a move heading into next month. Don’t jump in early but start to review the stocks on the daily screens and look for candidates that consistently show up every night. I am doing the same and looking to start with a fresh batch of stocks for the MSW Index.

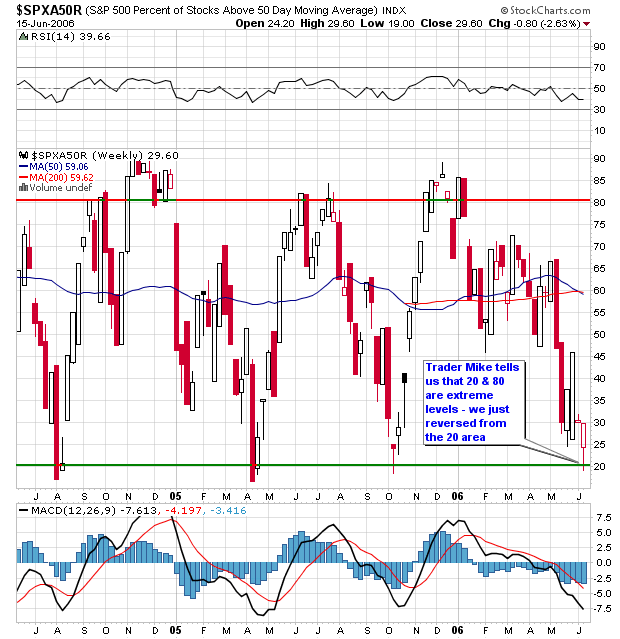
This next chart is one that is used by Trader Mike, a trader I have spoken about in the past, who I respect. It is the % of stocks above their 50-day moving average (it gauges the strength among the individual stocks on the index). I have never used this indicator but it seems very interesting so I will post it here for the first time. From what I understand, 20 and 80 are the extreme levels that can and sometimes do give buy and sell signals. For now, I will start to view it as a secondary indicator with relation to the NH-NL ratio I use. I would like to observe it for myself for a period of time before influencing decisions based on the action of the chart.

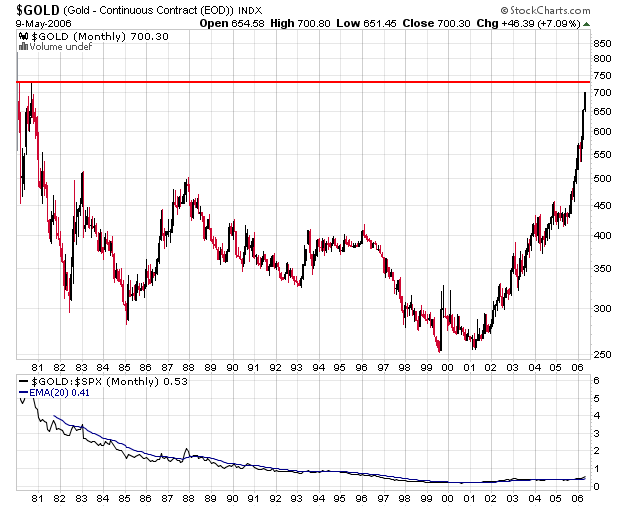
Finally, crude oil is still above the support area of $70 and until this breaks, I don’t see any major bull markets in the near future. Just an opinion of mine (I do understand that opinions are worthless in the market)!

Piranha

Market Reversal?

With rate hikes across the globe, the markets opened lower but stopped the bleeding around noon and started to construct an afternoon rally. The NASDAQ was down as much as 2.4% and losers were outpacing advances by a 5-to-1 margin but the reversal officially gave the market a day “1” count for an attempted rally. This time I will buy into the possible start of a rally but I will not “jump the gun” until I get a solid follow-through in one or more of the major indexes in the next four to ten days (preferably four to seven days). As IBD states (rules of William O’Neil’s CANSLIM), no major bull market has ever started without a follow-through from the initial day one attempt. I am not saying that this rally will work but I will take this move a bit more seriously than last week because I see many oversold indicators working together. Things can turn on a dime in the market and even though the NH-NL ratio and several individual market leaders got trounced, we can reverse for an attempted up-trend in less than a week. The DOW was up slightly on volume 38% larger than yesterday as the afternoon showed a nice surge in activity.

Even though the major indexes made solid reversals with spikes in volume, the NH-NL ratio weakened to its worst level of 2006 (49-371). Typical in 2006, we continue to see contradictory and conflicting data between the major market indexes and the “so-called” individual market leaders.

As you can see, day one of an attempted rally has passed and this is why it is very important to keep watch lists during poor market environments because we may have a buy signal within the next four to ten days.

Take a look at the first chart, it shows the daily reversal on the candlestick chart for the NASDAQ.

The second chart shows the NASDAQ in an intraday view with a nice mid-day reversal and afternoon up-trend with increasing volume.

The third chart shows the DOW from an intraday perspective as it mimicked the action among the NASDAQ.

Finally, I show a multitude of index charts that keep everything in perspective and show you that the market is still in a downtrend even though we may have witnessed a reversal.

Piranha

General Market Analysis: 6/6/06

A copy of the general market analysis I posted on MSW last night:

Every stock listed on the MSW Index was down today as the group fell 3.8% collectively with several doing so on above average volume. Sterling Construction (STRL) dropped the most with a 14.84% decline on volume 163% larger than the 50-d m.a. The two stocks that advanced yesterday, DXPE & LQDT, caught up to the rest of the field by dropping 5.53% and 8.17% respectively. The market is getting its ass kicked! Not the type of language I typically use but I need to make sure that I have everyone’s attention. I started to pull the community to the sidelines in early May and accelerated my campaign to cash throughout the month. If you are still being hurt on the long side by the recent declines, I suggest that you find something else to do with your money before it’s all gone. Every single indicator that the market has to offer has been telling to you to raise cash and move to sidelines until skies clear. If you are experienced enough to short stocks and play to the downside, excellent, but still use caution because this market cannot be trusted in either direction. It’s tough to just sit here and do nothing since I have been back from vacation but I am not crazy, I don’t like to lose money for no good reason other than boredom.

Looking at the broad market, we see the DOW fell to its lowest levels in months with a 16.1% increase in volume for another pure distribution day. The NASDAQ fell in higher volume to confirm a double bottom breakdown but it did attempt a rally towards the late afternoon (a strong final hour of trading). The NASDAQ remains below its 200-d m.a. as the DOW is above the long term moving average (recently fell below its 50-d m.a.) with a spread triple bottom breakdown confirmed on the point and figure chart today. The NH-NL ratio dropped to 50-253 today, confirming the weakness once again. With statistics like this, it is a waste of my time to upload screens that attempt to target stocks to buy. It is important to continue to watch the stocks with the best relative strength ratings but I will focus on possible shorts once again tonight.

Sectors with the most stocks making new lows included: medicals, building related stocks and retail stocks. Computer stocks have been getting slammed as well as several of these industry groups have fallen from mid-teen ratings to the bottom of the 197 member list in IBD (in less than three months). Speaking of IBD, they finally admitted that the market was in a downtrend rather than looking for this so-called rally or follow-through. I told you last Saturday that I was extremely skeptical of the follow-through they were looking for. Long term members of MSW understand that the NH-NL ratio will confirm a new up-trend so never jump the gun and buy before the rally is confirmed or when some other publication only suggests it could happen. I love IBD and I don’t understand why they gravitate so quickly to potential ups and downs; they never did this type of stuff five years ago.

Be safe in the market!

“Good judgment is usually the result of experience and experience frequently is the result of bad judgment” – Robert Lovell (quoted by Robert Sobel, Panic on Wall Street)

Based on my experience and judgment, I will stick to cash for now and wait patiently for the next move.

“Big money is made in the stock market by being on the right side of major moves. I don’t believe in swimming against the tide” – Martin Zweig

Piranha

Did the NASDAQ surprise you?

I wanted to share with everyone the analysis I posted up to MSW screens last night because it makes a firm point that some just don’t get! Some investors continue to be surprised – can’t help everyone!

MSW mid-week analysis (5/17/06 9:00pm):
I am extremely happy over the e-mails I received today, commenting on the expectancy post, from both MSW members and non-members. It means a great deal to see that so many people “get-it” and how a simple spreadsheet helps so many more get that “ah-ha” feeling. I am going to follow up that post with an answer to another question on expectancy tomorrow. I will continue to feed you these advanced strategies in stages so you can digest what I trying to convey.

Now, I don’t want anyone to write me an e-mail asking “what to buy” or “why is the market going lower”. Hey, if this is harsh, so-be-it because I can’t spell out the dangers in the market any more clearly than I have over the past two weeks. I have been uploading a red bold text warning that “NOW IS NOT THE TIME TO BUY” with the first portion reminding you about the ‘M’ in CANSLIM. I even provided a link to my article from last year on the ‘M’ in CANSLIM. If you buy in this environment, be prepared for days like today and be prepared to take heavy losses. When I slash the MSW Index down to 14 stocks, it’s for a very good reason: the market is WEAK! It amazes me that some people don’t “get-it” and must be invested at all times trying to pinpoint the bottom while searching for opportunities on the long side.

When my daily and weekly screens go blank or get slim in size, it is the best indicator to me that it is time to ease off margin, move to cash and entertain the idea of going short. When speaking about going short, you should start to analyze sectors or industry groups that are in late stage bases or contain stocks that are violating moving averages and support lines (simultaneously). To confirm the screens, the NH-NL ratio has tuned negative (the number one reason to stop placing long positions). I said this just last night after a period of strength among some of the recent leaders:

5/16/06:
“Even with the strength of our leaders today, I am still playing heavy defense due to the negative reading for the NH-NL ratio for the second day this week: 99-138 (74-241 yesterday).”

5/15/06 & 5/16/06:
“Tonight’s daily Screen is a pure Watch List looking for potential buy candidates in the future. The market health is weak so sit tight and brush up on your trading skills, system development and money management techniques.”

5/13/06:
“We have now witnessed six distribution days for the NASDAQ and four for the S&P 500 over the past month (clear signs of institutional selling).”

5/13/06:
“Both the NASDAQ and S&P 500 have violated their 50-d moving averages as the NASDAQ fell over 4% to close slightly higher than its 200-d m.a. The Index has closed at its lowest level since the turn of the New Year. If it violates its 200-d m.a., I see it traveling down to the long term trend-line that started in the summer (July) of 2004.”

5/17/06:
The NASDAQ is now trading below the 200-d m.a. and is sitting on the long term support line that dates back to 2004. Violating this trend line will be a major red flag.

5/13/06:
“Unless you are a day trader, I advise that you take some time away from the markets and regroup. I am going on a mini-trip over Memorial Day weekend and I suggest that everyone else take some time to enjoy other things or at least take a small break from trading (especially since our market environment has turned negative).”

5/13/06:
“The MSW Index is now going through some of the most dramatic changes in over a year. If you want me to post “buy candidates” then you don’t understand how the markets work. I am sorry but now is not the time to be buying (in my opinion) based on all of my indicators.”

5/13/06:
“The leaders are getting crushed and the NH-NL ratio is declining with a negative day on Friday.”

5/10/06:
“As we start to hit this stretch, follow the rules and never break a stop loss (it might even be time to take a break and enjoy the sun)!”

To top off all of these quotes, I wrote an extensive analysis last Saturday documenting the six month period between May and October (focusing on the weaker summer months since 1950). I showed you how stocks start to take breathers and decline during the months of May and June.

The DOW came within 80 points of its all-time high last week but we are traveling different waters this week as the index is now trading below the 50-d m.a. for the first time since late January and early February. Today’s 214.28 drop on the DOW was the largest percentage drop since May 2003 (that month of May again). The index was down 1.9% on volume 22.9% larger than yesterday (clear signs of heavy distribution). Want me to sound crass? I was not hurt by the drops in the market over the past five days of trading and I am extremely proud. I use the arrogance to help get the message into everyone’s head!

The NASDAQ is now showing a 0.4% loss for 2006 and is 7.6% from its 52-week high. The NASDAQ 100 is now 3% below the 200-d m.a. as 191 of the 197 industries tracked by IBD closed lower today (many on increased volume). The seven distribution days over the past four weeks should be sounding alarms to protect your capital. The NH-NL ratio closed at 56-250 today, continuing the streak of negative ratios.

REMEMBER THE ‘M’ IN CANSLIM! NOW IS NOT THE TIME TO BUY!!!
The ‘M’ in CANSLIM:

Take a look at the Industries that fell the most today (do they have something in common):

Copper
Aluminum
Steel & Iron
Gold
Oil & Gas Drilling & Exploration
Industrial Metals

*No new stocks will be screened tonight for good reason – I hope you get the point*

Piranha

New Highs Everywhere?

Investors sit patiently or anxiously in some cases ahead of the Federal Reserve’s next move on interest rates, to be announced today. The DOW is within striking distance of its all-time high of 11,722.98, reached on January 14, 2000. Crude oil is sitting slightly above $70 (near major support – also known as the prior resistance line). Gold is trading slightly above $700 an ounce, its highest level since 1980. With the stock market, crude oil, gold (and other commodities) all trading at or near highs, we know one of these areas must bust or give way to the others. I don’t have a crystal ball so I can’t tell you which area will fall first or the hardest but I have plans to protect my capital against any major decline or collapse. Take a look at the 10-year chart of the DOW and see how close we are to making a new all-time high. I am waiting for the Fed announcement later in the day to see how I will continue to play positions going forward.

Piranha