General Market Analysis

Due to our typical mid week special screen, I have uploaded another mini-screen with general market analysis and a few stocks that made noise on Wednesday (a few MSW Index stocks are included).

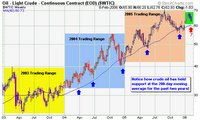
Oil prices fell again ($62.55) but still remain at historical highs. To put today’s prices into perspective, we must look at a multi-year chart to see how inflated the price of crude truly is. In 2003, crude was slightly above $30 a barrel and maintained its price throughout the year to close in the same vicinity in 2004. In early 2005, prices closed slightly above $40 en route to $70 over the next twelve months. Crude has dropped over $6 since the peak in late January which was close to the record highs set in late August. Supplies are up in the United States but many investors and analysts (yes the talking heads) still fear the tensions in Iran and the supply fears out of Nigeria.

So what does all of this mean?

It means that the market and investors are unsure of themselves and their investments with many questions unanswered. Looking at the New High-New Low ratio (NH-NL), we can see the dramatic drop in support of the leading stocks over the past week. The number of new highs for the first three days of this week has dropped 48%, 63% and 66% from the ratio of the first three days of last week. Even though we started last week with ratios of 572, 545 and 571, we ended the week in a decline, closing at 218-55. So far this week, we failed to surpass 200 new highs, two of the three trading days, not a sign of strength. Adding to this analysis is the fact that several stocks have been removed from the MSW Index based on sell rules and the fact that the Index dropped 4.65% earlier in the week.

The NASDAQ did manage to close back above the 50-d m.a. with a 1% gain and did close in the upper half of the day’s trading range (the first positive sign of the week). Cisco Systems posted earnings that topped analyst expectations, lifting the big cap stocks higher. As Investor’s Business Daily noted, recent leaders (AAPL), (HANS) & (GOOG) have fallen along with many of the leading energy stocks over the past few weeks. I know many of you have been locking in gains or cutting losses during this tumultuous environment and I commend you for following the rules. By following the rules, you will save yourself money on all fronts.

A few stocks that made some noise from yesterday:

  • STMP – 30.99, a stock we have been following on the daily screen for months. The recent slide to the 50-d m.a. turned out to be an excellent buying opportunity for trend traders.
  • EXBD – 102.25, another stock completed the $60-$100 move. The pattern was text book at it hit the $60’s and then corrected for several months before making the true run. The advance took about a year as patient investors were rewarded.
  • MLR – 24.50, after the correction from $22, the stock based and is now moving to new highs. The correction lasted for four months and should have shaken out most of the weak holders
  • TS – 156.44, up over $8 on volume 125% larger than the 50-d m.a. (the stock is now forming a high handle to the cup shaped base that lasted for four months)
  • OXPS – 30.97, up on volume 227% larger than the 50-d m.a. as the stock has setup another double top breakout above $32
  • HAL – 74.55, after reaching a 52-week high above $80, the stock has now corrected due to the drop in crude oil. The stock is energy related and has large ties to the Middle East which is at unease with the tension in Iran

Piranha

General Market Analysis

…I started the daily screen commentary last night with words of wisdom about past trades and I posted up a great quote from a great poker player. Why would I use a poker analogy with trading in the markets; because I believe they are very similar. For more on the similarities, you can visit my blog article on the subject:
http://www.marketstockwatch.com/2005/07/poker-and-stock-market.html

As for the quote, I will repeat it here for everyone:
Said by the Matt Damon character in the movie Rounders:
In “Confessions of a Winning Poker Player,” Jack King said, “Few players recall big pots they have won, strange as it seems, but every player can remember with remarkable accuracy the outstanding tough beats of his career.” It seems true to me, cause walking in here, I can hardly remember how I built my bankroll, but I can’t stop thinking about the way I lost it.

The quote couldn’t be truer when I think back about my winners and losers over my trading career! I am not a high roller when it comes to poker but I do remember specific hands that I have lost when I calculated a win in my head (based on the odds I was betting).

If you had any tough beats in 2005 while trading in the markets, sit down and face those losses and don’t let them haunt you in 2006. Understand why the trade went bad and analyze how and why you reacted the way you did. Write down and think about how you can correct these past mistakes so you can try and avoid them in the future. It doesn’t matter how many years of trading experience you have because mistakes will always happen. The game of investing is not about winning and losing, it is about playing the odds and managing your money so you don’t get one of those bad “beats”. The same holds true for poker when playing over a long period of time.

Looking at the NASDAQ, we can see that it held support at the critical 2,200 support line and has raced ahead by 70 points at 2:00pm on Thursday. Volume will come in higher this week versus the past two weeks due to the holidays so it won’t play such a big role when looking down upon it as accumulation. The more important statistic that shows the market is gaining some strength this week is the number of stocks making new highs. Last night we just missed 500 new highs, a critical signal to let us know that the market is gaining strength. If the NASDAQ closes higher today, it will represent the third straight session with a gain as it approaches its 4 1/2 year high.

The DOW broke the support line of 10,750 last week but has managed to recover the line this week in nice fashion. After the big gains on Tuesday, the index is up over 150 points this afternoon as I write this analysis. The price relative to the S&P 500 is still at multi-year lows but that does not matter so much because the S&P 500 has been outperforming the DOW. A quick look at the yearly chart for the S&P 500 will show you that it has held its support line similar to the NASDAQ, hence the strong RS lines for these two indices.

Tonight I will cover the close of the indices today and will take a closer look at the handful of MSW Index stocks that are near major moving averages (buying points from the past two years).

See you tonight,
Piranha

January Effect “2006”

…I wrote an article about the so-called “January effect” last December right here on this blog. Many publications and stock market “gurus” will be talking about the January effect and how you may profit from the cyclical trends that supposedly exist. Portions of this entry will reiterate what I said last year but it is important to restate what I believe may help you ignore these talking heads.

Here at MSW, we follow rules and we try to eliminate emotion or at least keep it a bare minimum which allows us to invest intelligently. Without our philosophy, we would be aimlessly throwing money in all directions, hoping and praying for profits. We would most likely listen to hot stock tips and jump on the bandwagon of every new trading system or theory that came across our desks and computer screens.

The rumblings about the “January Effect” are starting to appear in stock market newsletters, brokerage house e-zines and the mainstream market media. I cringe every time I hear some talking head try to convince investors to buy beaten down shares in companies that will bounce in the first several weeks of the year. I see too many people jump at the opportunity to change their investing beliefs because some analyst on the other end of computer wrote an article claiming to make you lots of money in the first several weeks of the year.

Now, looking back at the MSW screens from late December and January, we did find several small cap stocks (below $10) that did make some big moves but they were still part of my system. I didn’t jump ship in search for a bounce back stock. These stocks included:

SPTN: first covered on 12/31/04 at $6.64 (made a total of 16 weekly screens with the last screen in July 16, 2005). Peak screen on 7/9/05 at $15.04, 127% gain

CULS: first covered on 1/9/05 at $7.69 (made a total of 9 weekly screens with the last screen on 4/16/05). Peak screen on 4/9/05 at 11.53, 50% gain

FORD: first covered on 1/23/05 at $6.38 (made a total of 32 weekly screens with the last screen on 11/19/05). Peak screen on 8/6/05 at 26.80, 320% gain – Top gaining MSW Stock in 2005!

Be strong and ignore the noise coming from every direction. Instead of looking into their theoretical bounces that may or may not occur, take the time to review last year’s trades and document the good and bad aspects of your portfolio. Look for your best trades and understand why you made money. Study your poor trades and understand where you made the mistakes. Correct those mistakes in the coming year.

Be honest with yourself and flag the areas of your trading system that need the most work and continue to polish your strengths. Don’t abandon what is working because a “talking head” on television tells you his system works in only 15 minutes per day, two days per week. In recent months, we have talked more about options and the leverage they provide and I know some of you have made decent profits in 2005 due to call contracts. Don’t get over excited and think you will be a multi-millionaire by the end of 2006 because you have invented the latest “fool-proof” options strategy. Work the system step by step and document what works and what doesn’t wok. Don’t bite on the “get rich quick” options programs that play across your television at 3am on weeknights.

Stick to one system that works and try to consolidate the strongest features of that system to your advantage and ignore the hundreds of other systems and indicators that can be found on every investing web site on the net.

We focus on price and volume here at MSW, which is all you need to become a successful trader. Establish strong or accelerating fundamentals and then confirm a quality trend on the charts and you will reap returns better than 99% of the general population.

Stay focused in the New Year, start fresh and think positive! Instead of reading 100 books this year on 80 different trading systems, reread a few essential books that focus on one system that best suits your style of investing. Good luck in 2006!

-Piranha

Question: Is the Rally Over?

Member E-mail Question:

Chris –
Is it just because of the recent news stories – auto manufacturers axing jobs at Christmas time – that the market seems to be moving sideways again?

I have been encouraged because of the NH-NL ratio. Also I had some early fortune with my first 2 or 3 attempts at Options trading. So, when I invested more, and things turned south, I’m wondering what’s up.

It looks like QSII will need to find support at the 50-MA. Is that what you see? What’s going on with WC I bought at the break out above $78 and hasn’t done much but flounder. ESRX is also down. Is the rally over? Is it because of all the talking heads that people sat up and thought they’d take profits? Maybe we’re getting set up for a fix in 2006?

The only Option I’m doing well in right now is DO.

I try not to get too anxious thinking that the 60-100 route may take 7 – 12 months to complete and I’ve got until June on my Options, but…

Thanks for your feedback.

MSW Member

My Answer:

The market has been going up for several consecutive weeks so I believe it is taking a well deserved breather. The NH-NL ratio has been increasing when looking at the weekly averages but it has never crossed over the critical 500 new highs per day (a key level for long term rally success). In any event, the rally is still intact and is allowed to pull back from time to time. The ideal time to enter the market was in late October and early November so your gains can cope with a correction similar to what we are seeing. IBD confirmed the rally before I did because I was cautious but I still confirmed the rally in October (weekly screen on 10/22/05). This is when I started to place new positions in MSW Index stocks and when I gave the green light to start buying.
I think you are looking at these stocks from a very short term perspective. Take a look at each stock’s two year chart and you will see that they have all corrected from peak prices from time to time. You need to tell yourself that stocks can’t go up everyday and they must correct when they make a strong move similar to what we have seen in ESRX.

QSII should find support near $74 and then down at the 50-d moving average. The stock corrected in October before the recent run and had a big correction in May and June of this year. Look at the longer term picture and characteristics of the stock.

WC has struggled since breaking above $78 but I have seen this pattern in the past for this stock. The key support level is the 50-d m.a., a support line it has used several times over the past few months. Until it breaks this line, I will not start to turn bearish on this stock. I will admit that yesterday’s action was a bit disturbing for the intraday reversal.

ESRX has moved from $62 to $88 in six weeks so a correction is greatly expected. This stock can’t continue to advance like it has for another six weeks. If you own ESRX, you may want to take the profit if you are worried about the rally ending because the support level is not anywhere near the current price (it’s down in the $60’s). As I said on the daily screen last night, I have placed a physical sell stop in this stock to protect my recent profits.

As far as the rally is concerned, continue to watch the stocks in your portfolio and the MSW Index. If they fall for one or two consecutive weeks, start to lock in profits because the “market” is telling you to do so. Don’t sell after one or two bad days because you could miss the “bigger, more important” profits. Also focus on the NH-NL ratio as you have been doing because this indicator is extremely powerful and can give you a quick glance of the overall trend of the market because it tracks the leaders.

As for your options, give them room to breathe because June still seven months away and a lot can happen (look back seven months for the stocks you own because I am sure they corrected along the way but still managed big advances).

Chris

Weekly Commentary Insert

Here is a partial insert from our most recent weekly screen:

Market Overview:
With the end of this weekend, we are greeted with the end of the summer and the end of vacation for most major institutional traders, managers and players. I have been speaking about the slow summer months and the thin trading that usually accompanies these months, followed by stronger fall months and typically solid January and February months. I will now present you with hard data to support the statements that I have been making all summer long. An old saying on Wall Street goes like this:

“Sell in May and go away”

The data that I will present has been researched in Hirsch Organization’s Stock Trader’s Almanac and an article written by Elizabeth Thompson. They explain that the market has a very distinct seasonal indicator, one that was popularized as the “Halloween Indicator”, directly relating to the quote above.

According to the Almanac, if an investor invested $10,000 in the DJIA on November 1 and sold on April 30 every year from 1950 to 2004, they would have earned $492,060. If this same investor did the opposite and had bought on May 1 and sold on October 31 from 1950 to 2004, a $318 loss would have resulted. That is an amazing stat, one that is difficult to fathom. This trend extends outside of the American stock market as an article from December 2002 of the American Economic Review says that such a statistical pattern existed in the U.K. stock market as far back as 1694 and still exists today.

As I have mentioned many times in my daily and weekly commentary, big time Wall Street fund managers and traders go on vacation to the Hamptons, upstate lake side homes and international destinations. While these investor leave, they sell their weak holdings and have their staff sell anything that becomes weak while they are gone. They basically clean house and sell any investments that can’t survive while that are not at the helm. This results in the thin volume that we see year in and year out from June to August.

According to Elizabeth Thompson’s article Gone away for the Summer? It’s Time to Come Back, she states, “that the financial world encourages investments in the November through April period more so than in the May through October period.” She further states that January is the month that employees sign up for 401(k) plans while IRA’s have an April deadline which requires investors to place more money in their stock related retirement funds. This type of setup brings an influx of money to the table during the beginning of each year and naturally pushed prices higher before the flat summer months when they typically correct.

September is historically one of the worst performing months in American stock market history but it can also present an ideal opportunity to place positions on stocks that are showing excellent relative strength. Typically, these stocks go on to be market leaders and breakout after Halloween and into the New Year. November through February are some of the best performing months in Wall Street history but if you wait to place positions at the end of this range, you may be buying extended stocks that are poised to drop as the spring ends, creating losses in your portfolio. There are always exceptions to historical data and the rules so we want our MSW community to follow the daily and weekly action of the market before buying and selling. One more study suggests that the market will continue do trade the way it has traded for the first five months of the year. If this scenario holds true to 2005, we will be stuck in a sideways market for another four months. Regardless, I will be here researching the leaders and trends and will give you my best analysis outside of predictions and historical data. I felt that this historical data would help some investors realize that the market does work in predictable ways from a long term macro view.

As for this week’s market action: The unemployment rate fell to a four year low of 4.9% while the price of crude oil futures fell $1.90 to $67.57 per barrel. Gasoline futures fell 22.53 cents to $2.1837 a gallon as the national average price at the pumps rose to $3.00 per gallon. I filled up my tank yesterday for a total of $46.53, the highest price I have ever paid at the gas station (luckily, I don’t drive an SUV). Just a few years ago when I lived in NY, I enjoyed paying $0.99 in New Jersey because the price in NY was higher at around $1.29 per gallon. I didn’t go out of my way to fill up in NJ but the $1.29 now seems like a huge bargain compared to today’s prices.

The NASDAQ managed a weekly gain on below average volume but it did stay above the key 50-d m.a. We saw an increase in the daily new high ratio mid week and a slight decline on Friday but that is mostly due to the holiday weekend. The DOW was up for the week but remains below both key moving averages. Looking at our weekly list of stocks, I can say that they are some of the best performing stocks in the market over the past several months. This list may contain some stocks that will become the leaders in the next rally that may happen near Halloween if the analysis and data from above holds true.

Enjoy the long Labor Day holiday! Keep the people from the south in your thoughts and prayers. Also remember that the stock market is closed on Monday so there will not be a daily screen. We will be back on Tuesday with a brand new quality daily screen!

Piranha