Quadruple top Breakout (LOOP)

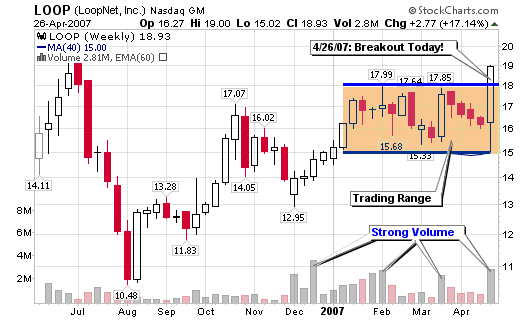
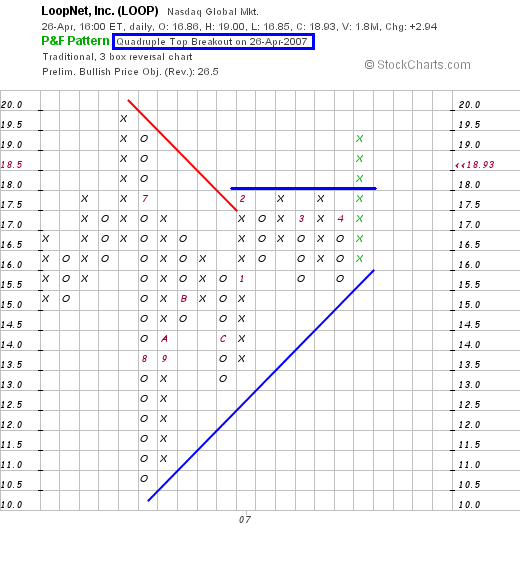
LoopNet was up 18.39% today on volume 700% greater than the daily average (huge exploding to the upside). This volume explosion was accompanied by a breakout on the daily chart, the weekly chart and the point and figure chart. The pattern on the P&F chart qualified for a quadruple top breakout which is a powerful signal. It doesn’t guarantee success anymore than any other signal but it must be noted.

042607_loop_wkly.png

The company beat earnings expectations yesterday and reported higher earnings which led to today’s nice move. As an article noted earlier in the day, the company operates the largest commercial real estate marketplace online and has surpassed the two-million registered members milestone. As of March 31, 2007, LoopNet reported 2,003,498 registered members and became the first and only commercial real estate service to surpass two million members.

Although the residential marketplace may be soft (not a bust in my opinion), the commercial marketplace is still booming.

LoopNet was screened on MSW back in late 2006 as an IPO to watch in the future and may be starting the run that I anticipated it could take late last year. As we look for red flags on the downside, this green flag on the up-side is one to be noted.

The next major milestone will be a new all-time high above $19.92 (closed at $18.93 today).

042607_loop_pnf.png

Here are some interesting Institutional Numbers:
Held by Institutions: 24%
Money Market: 60
Mutual Fund: 60
Other: 4

Shares Bought: 7.5mm
Shares Sold: 2.1mm

Shares Held (currently): 16.0mm
Shares Held (previous period): 10.6mm

Value of Shares Bought: $129.0mm
Value of Shares Sold: $37.2mm

Five Month Triple Top Breakout?

Ready Mix (RMX) was a stock that we started to target after the IPO last fall. We posted a case study on the member’s section of MSW on 9/20/05 with fundamental analysis and detailed chart analysis. The most interesting piece of the chart analysis was the breakout area that we targeted in September of 2005:

September 6, 2005 (first daily screen appearance):
RMX – 15.78, new IPO that provides ready mix to construction projects near Las Vegas.

September 10, 2005:
RMX was mentioned on a Secondary watch list on the Weekly Screen

September 17, 2005:
RMX makes the official watch list on the weekly screen at $16.60… Here were our comments:
“Young IPO that was mentioned last week and studied this week. The breakout would be a move above $17.50 on above average volume.”

As we start to watch Ready Mix (RMX) once again, we have come up with the exact same breakout point that we targeted five months ago before the recent basing pattern. The buy was never signaled back in September and I am not sure if it will happen this time around either but it was not a coincidence that the stock reached $17.50 intraday today and then retreated during the afternoon hours.

Take a look at the three charts posted in this blog:
The first is a combo from September 21, 2005 as the stock was just debuting on the exchanges as an IPO from August.

The second chart is from today as the stock is about to complete a five month basing pattern with the EXACT SAME TRIPLE TOP BREAKOUT from September.

The third chart is the Point and Figure that has the chance for a triple top breakout (starting back in September).

If the stock breaks-out from this triple top breakout, I would have to believe that I was the first one to call the buy back in September 2005 (I am joking with this statement).

Ratings in September 2005:
EPS: 79
RS: 92
Industry Group: 40 out of 197

Ratings today (2/27/06):
EPS: 95
RS: 84
Industry Group: 66 out of 197

Piranha