The Best Home Builder Stock

The analysis below will show you why I select this stock as the best bet when the builders eventually hit a bottom and start moving higher.

Nathan Rothschild, founder of one of Europe’s most-powerful economic dynasties, uttered one of the most frequently quoted maxims on investment timing in the early 19th Century when he said, “The best time to buy is when blood is running in the streets.”

Now, blood is running in the streets for this industry and the homebuilders are getting their rear-ends kicked by Wall Street, the media and anyone else that will jump on the bandwagon.

082407_list_builders.png

So, when will the bottom arrive? Who the hell knows? And if someone tells you they know, just walk away because they are fooling themselves and anyone who listens.

The bottom may be near but the upswing could take years if you go back and research history. Badly beaten down industries can take anywhere from two to five years to rebound and start trading higher.

With that said, I would like to tell you why I feel that NVR Homes (NVR) is the best bet when the bottom does arrive and we start to see some life in this area.

082407_nvr_builders.png

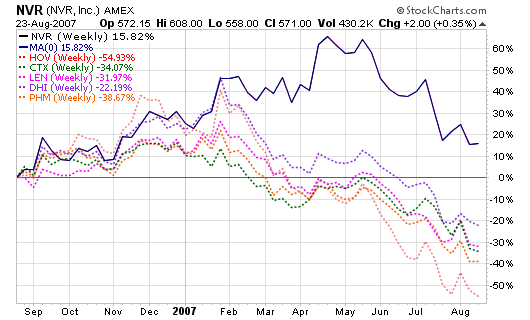
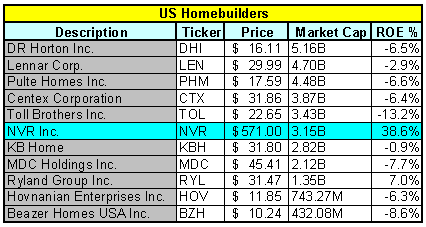
Let’s start with the charts above. They shows us that NVR now has the sixth largest market cap and is the only leading US Big Builder to boast a current ROE above the double digit threshold (positive of course). Of the ten other major players, only Ryland Group (RYL) has a positive ROE while writing this piece. This is major because every one of these stocks were reporting 20%+ ROE’s over the past five to seven years with several of them averaging 35% or better. NVR had an ROE of 105.2% in 2003, 78.7% in 2004 and 92.3% in 2005.

NVR was one of the smarter builders by scaling back their land purchases in 2005 and 2006 when everyone else was going nuts buying land that was way overvalued. They were also the only homebuilder to receive a report card grade of A- by Big Builder Magazine in the May 8, 2007 edition. The magazine said:

NVR’s inimitable focus on EPS growth through capital allocation discipline and land-risk minimization has positioned the company to weather a deep and long downturn in superb condition. The company’s extreme concentration in the Washington, D.C., market and its immediate environs exposes it to that market’s vulnerabilities but allows for peerless operational discipline and flexibility in light of situational opportunities that emerge before a wider recovery. The company’s market share strength in its competitive arena give it leverage in renegotiating terms on optioned takedowns, allowing the builder to remain in control of assets even in a slower sales pace environment.

[Read more…]

BODIES, Premier Exhibitions

Stock of the Day
Premier Exhibitions Inc. (PRXI)
Wednesday’s Intraday Price: PRXI – $14.99

Sector: Consumer Discretionary
Industry: Leisure Facilities
52-week Price: $4.63 – $18.62

BODIES, The Exhibition is currently receiving worldwide acclaim attracting nearly five million visitors in New York, Las Vegas, Washington, DC, San Diego, Durham- NC, Branson- MO, Sao Paulo, Lisbon and Prague.

I have been to the exhibition in NYC, down at the South Street Seaport and all I can say is: AMAZING.

The exhibition was fabulous and my wife (the biology/chemistry professional) agreed. See the bottom of this post for a detailed description of the company. I should have bought shares in the company over the winter if I subscribed to Peter Lynch’s idea of successful investing: buy what you know and like. Unfortunately for me, I had no idea that the company presenting BODIES was publicly traded. It has doubled in price since I walked in and out of their doors.

081507_prxi_wkly.png

What caught my attention is the accumulation of shares by institutional investors and the strong up-trend on the weekly chart.

Ideal Trade Set-up:
Ideal Entry: $11.60 (currently $14.99)
Risk is set at 1.0% maximum of total portfolio or $1,000 of $100k
Stop Loss is 10% or $10.44 (below the spike in price in May)
Number of Shares: 862
Position Size: $10,000
Risk: $1.16R
Target: $24
Reward-to-Risk: 7.75:1

Accumulation Trade Setup:
Ideal Entry: $14.00-$14.50 (currently $14.99)
Risk is set at 1.0% maximum of total portfolio or $1,000 of $100k
Stop Loss is 25% or $10.49 (below the spike in price in May)
Number of Shares: 286
Position Size: $4,000
Risk: $3.50R
Target: $24
Reward-to-Risk: 2.85:1

[Read more…]

Earnings and Sales Leaders

If this market has another leg up, these six stocks will continue to lead the way based on their impressive three year sales and earnings numbers.

I know they look extended and have come a long way but stocks that are accustomed to making new highs typically continue to make higher highs in a bull run. Remember, what seems high to one investor may still be low to another. Look for the stocks to establish support along moving averages or key areas prior to entering a position.

081407_numbers.PNG

Stocks are traded based on perception and if the smart money crowd perceives these stocks to go higher, they will jump in and push them higher. Besides, additional buys will only support the large cash positions that institutions have already established in these stocks throughout 2007. Take a look at the institutional numbers below to determine if smart money is pouring in or out.

As you can see, the latest numbers are telling us that institutional money has been leaving both CROX and BIDU while it has been pouring into PRXI, STP and ARD. Don’t use these statistics as your sole reason for buying or selling because they do lag the market but understand that they can confirm trends on the charts.

*All data from latest reporting periods*

Crocs (CROX) Institutional Analysis:
Total Institutions: 535
Money Market: 220
Mutual Fund: 304
Other: 11

Shares Held: 116.8 mil
Shares Held Previous Period: 118.3 mil

Shares Bought: 28.4 mil
Shares Sold: 29.9 mil
Value of Shares Bought: $1.43 Bil
Value of Shares Sold: $1.5 Bil

081407_crox_wkly.png

Baidu.com (BIDU) Institutional Analysis:
Total Institutions: 238
Money Market: 117
Mutual Fund: 119
Other: 2

Shares Held: 19.5 mil
Shares Held Previous Period: 22.0 mil

Shares Bought: 6.5 mil
Shares Sold: 9.0 mil
Value of Shares Bought: $1.36 Bil
Value of Shares Sold: $1.89 Bil

081407_bidu_wkly.png

Premier Exhibitions (PRXI) Institutional Analysis:
Total Institutions: 69
Money Market: 42
Mutual Fund: 26
Other: 1

Shares Held: 11.7 mil
Shares Held Previous Period: 2.8 mil

Shares Bought: 9.5 mil
Shares Sold: 0.6 mil
Value of Shares Bought: $160.2 Mil
Value of Shares Sold: $9.8 Mil

081407_prxi_wkly.png
[Read more…]

Tracking Garmin (GRMN)

I was driving the Road to Hana in Maui in April and telling my wife how great the Garmin was working in our Jeep. I insisted that we should both get one when we get back to Jersey and she even named the Garmin “Cathy” while on the island. We used it to find Costco, Mama’s Fish House, our surf and snorkel gear and an Outback Steakhouse. The thing was awesome and so accurate. It was April and Garmin was a stock I just sold for a small 15% profit on a short term trade. What the hell was I thinking?

080307_grmn_wkly.png

Ride the trend. The trend is your friend. Sell with a violation of the 200-day moving average. Don’t bother short-term trading. Keep commission costs down. Etc…

These are all things I attempt to follow with every trade. I went through a phase where I wanted to become a short term trader but realized that it wasn’t for me, not at this time. So, I looked in the mirror and admitted that I do my best work when trading longer term weekly trends. I am not TraderMike or Charles Kirk.

This “short-term” strategy seemed to make me some money earlier in the year when I quickly grabbed that $15% gain in GRMN, selling at the top of a gap-up. I nailed it; sold at the top and walked away a winner. WRONG AGAIN (this seems to be happening a lot this year: leaving profits on the table). I admit that it’s been a great year but I left this home-run on the table and only took down some scraps. My profits from February could have increased another 4 times had I stayed in the position patiently.

My short term trade was initiated on 2/1/07 at $49.74
The stop loss was 8% or $45.76
Target was $60
I sold on 2/23/07 at $57.55 for a 15.70% gain
A 1.9R gain

It never hit the stop so the current gain would be (as of 8/2/07):
96.80% or
a 12R GAIN! – Home RUN!

Garmin was a prime candidate for the $60-$100 run that I so often target, a run that I followed heavily for dozens of stocks on MSW over the years. I lost my focus on this stock and it cost me a lot of money (not in losses but in regrets).

080307_grmn_daily.png

Anyway, here is some of the Garmin (GRMN) coverage that I posted to the blog over the past year. The stock also appeared on the MSW Index many times in 2006 and 2007 (before I closed it down in March).

  • Indicators and Research Save me Money

    I saved the portfolio $4,000 in profits from my sales on Friday and Monday (GRMN and SLW).

  • Support at the 200-day Moving Average

    GRMN – $49.69 -sitting on the 200-day moving average!

  • Ten Stocks to Watch

    GRMN – $47.18 ($95.35) down over 2% for the week but the stock continues to hold the 50-d m.a. as support while maintaining a presence near the psychological triple digit threshold. I still like the stock in a rallying market (could make a nice option play for a solid run).

  • MSW Market Overview

    Looking at the MSW Index, we see that every stock fell for the week, so which ones dropped the least?

    GRMN: -1.75%
    TS: -2.71%
    GRMN – $49.12 ($99.26), These were the only qualifying stocks from the MSW Index that fell less than the major indexes. Garmin (GRMN) fell less than every major market index and found support near $95 and the 50-day moving average. It did qualify for distribution, the first in 13 full weeks.

  • Interesting Stocks with 15% of a New High

    GRMN – $31.88 ($64.42), flirting with the 50-d m.a. as the stock sits in the $60 range but is not a an official $60-$100 candidate until it can breakout above the recent peaks set at $70.07 and $68.88

Down with Under Armour (UA)

I was screening and watching Under Armour (UA) in early 2006 for MSW but the stock never materialized into what I thought it could be.

080107_ua_intra.png

I love their products and always wear their gear when playing flag football in the fall and rafting the rapids in the spring. However, this has never translated into a profit for me as I just don’t trust this stock.

Yes, it has been trending higher on a very slight angle over the past two years but it never worked out to be that homerun retail stock. I was thinking another Coach (COH) and I was thinking wrong.

I just don’t buy into the stock, even with a solid earnings release and a strong gap-up on the charts.

So what should I do?

Well. I followed my discretionary gut feeling and pounced on August put options this afternoon. I bought high this morning and lowered my cost basis this afternoon. Look for $1.15 to $1.50 in my trades. My target: $60 strike price.

Why? I am looking for the gap to fill after the earnings release. If the stock holds strong, I will roll them over to next month (if that’s the correct option terminology). The gap should fill; now I just need to nail the time frame and grab some profits. Maybe it won’t work but I tried.

080107_ua_daily.png

On another note, the AUG $140 puts for AAPL were trading at $2.55 last week and reached an intraday high of $13.40 today. It’s too bad I chickened out and never purchased them. I could have gotten out above $12 per contract for a 375% gain in one week. The Apple (AAPL) freaks scared me so I passed.

This is why discretionary can be costly!