Stock of the Day – Update
Rochester Medical (ROCM)
Monday’s Closing Price: ROCM – $16.44
Sector: Health Care
Industry: Health Care Supplies
52-week Price: $6.85 – $29.76
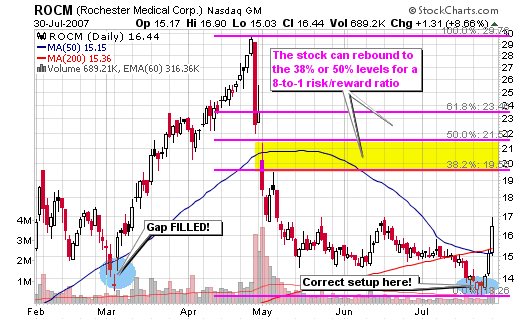
Well, ROCM is now up almost 20% from its low last week and I don’t own shares!
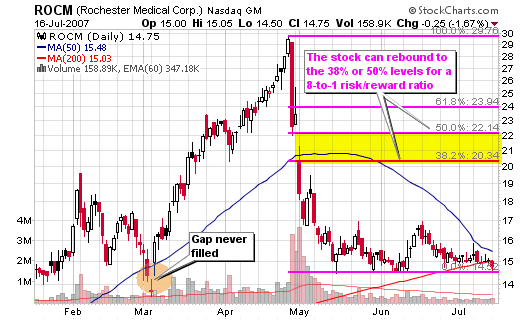
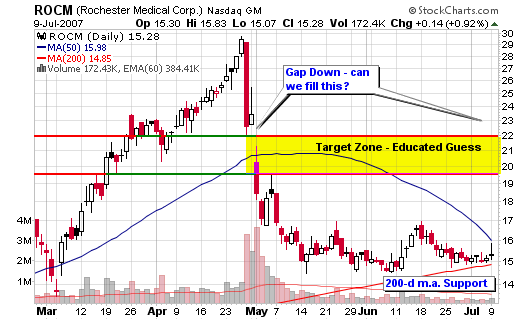
Why? I had to sell based on my setup. See the trade setups below which turned out to be WRONG. I COMPLETELY understand why they were wrong and it was staring me in the face the entire time; after Dankkir noted the un-filled gap on the charts that I essentially ignored. Well, if we waited more patiently and placed the position when the gap filled, we would still be holding into today’s action with an approximate gain of 16% and earnings due to be released after the market close. I can’t tell you if I would have held through earnings today.
I made a mistake, closed my loss and went back and studied what I did wrong. Therefore, I will be prepared to look for these things in the next opportunity. I placed my first trade over 10 years ago but I still make small careless mistakes but the most important thing was that I didn’t allow it to hurt me! I followed my rules!
This should have been the ideal trade setup:
Ideal Trade Set-up:
Ideal Entry: $14.14 (area where gap was closed)
Risk is set at 1.0% maximum of total portfolio or $1,000 of $100k
Stop Loss is 8% or $13.01 (below the gap area)
Number of Shares: 884
Position Size is $12,500
Risk is $1.13
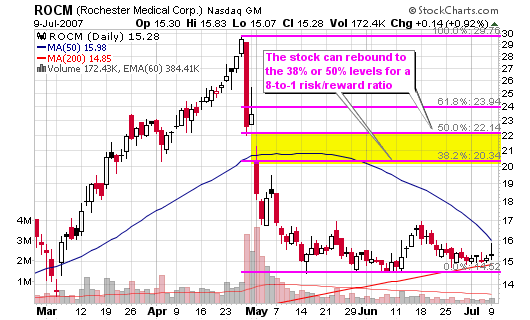
Target is $21
Risk-to-Reward is 6-to-1
Potential Trade Set-up #1 – WRONG!:
Ideal Entry: $15 (currently $15.14)
Risk is set at 1.0% maximum of total portfolio or $1,000 of $100k
Stop Loss is 5% or $14.25
Number of Shares: 1,333
Position Size is $20,000
Risk is $0.75
Target is $21
Risk-to-Reward is 8-to-1
Potential Trade Set-up #2 WRONG!:
Ideal Entry: NOW (currently $14.75)
Risk is set at 1.0% maximum of total portfolio or $1,000 of $100k
Stop Loss is 5% or $14.01
Number of Shares: 1,356
Position Size is $20,000
Risk is $0.74
Target is $21
Risk-to-Reward is 8-to-1
*This trade setup could have worked with a 10% stop loss.*


Connect with Me