Skip the Cup with Handle (CTRP)

I should have skipped the cup with handle with CTRP in 2005 and bought the 200-day moving average trend buy.

Back on August 23, 2005, I wrote a case study on Ctrip.com Intl. (CTRP) while the stock was trading at a pre-split adjusted $53.57. I knew Chinese stocks were something to watch in the future, especially after the huge speculation runs of SINA and SOHU; so I took a position. Problem is, I took the position on the cup with handle breakout but was later forced to sell based on a sell stop and never caught the entire run (the market was shaky at the time).

013007_ctrp_update_sm.png

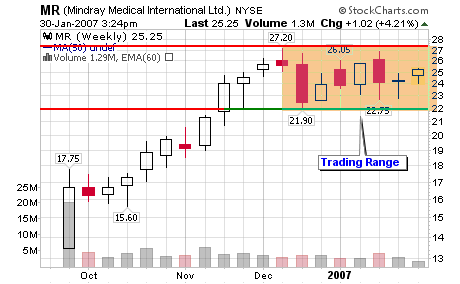
CTRP is one of the reasons over the past couple of years why I have minimized buying cup with handle breakouts and search dearly from 200-day moving average trend buys. Later in 2005, when I was forced to sell, the stock held support at the 200-d m.a. and never violated the long term average. This was the ideal trend buy for the young growth type stock. Instead of buying in 2005, I was selling. Now in 2006 and 2007, I do the opposite. I watch others buy the breakout and I enter my positions closer to major support areas such as the 200-d m.a. CTRP was one of the original high fliers from the Chinese market but several new faces are looking to take off, including MR which I highlighted yesterday.

I am reading a pamphlet from Investment U, titled Profit from China by John Wiley & Sons and it’s not bad. I found the quote by Jim Rogers (co-founder of the Quantum Fund) to probably be accurate:

“The nineteenth century belonged to Britain. The twentieth century belonged to the United States. And the twenty-first century will belong to China”

Past Blog Appearances by CTRP:
Ctrip.com (CTRP) Updated – 3/15/06

Tuesday’s MSW Daily Screen – 11/15/06

Here is some of the research from the case study I performed back in August 2005:
8/23/05
CASE STUDY – Cup with Handle Setup
CTRP – Ctrip.com Intl ADS

082305_ctrp_weekly_sm.gif

Leisure Services – Transportation

3-Year EPS Rate: 113%
3-Year Sales Rate: 83%
ROE: 28%
PEG: 1.13

EPS Analysis:
2003: 0.06
2004: 1.02
2005: 1.48 (E) High estimate: 1.62
2006: 1.98 (E) High estimate: 2.39

Revenue: (in millions)
2003: 173.00
2004: 334.00

Net Income: (in millions)
2003: 53.8
2004: 133.00

Number of Institutions (last reporting period):
Total: 38
Money Mangers: 21
Mutual Funds: 16
Banks: 1
Insurance Co.: 0

New Positions: 16
Positions Sold Out: 9

Here are some Updated Numbers from 2007:

013007_ctrp_weekly.png

3-Year Net Income: 150%
3-Year Sales Rate: 75%
ROE: 32%

EPS Analysis:
2005: 0.86
2004: 0.51
2003: 0.03

Revenue: (in millions)
2005: 67.18
2004: 40.32
2003: 20.91

Net Income: (in millions)
2005: 224.0
2004: 133.0
2003: 53.8

Number of Institutions (last reporting period):
Total: 60% Holdings
Money Market: 88
Mutual Funds: 158
Other: 11

As we can see, 67 new money mangers own the stock, 142 new mutual funds own shares and 10 other institutional holders have grabbed shares since my case study in 2005. This explains exactly why the 200-d m.a. held support at each challenge over the past two years.

This is basic common sense!

China’s Mindray Medical Intl. (MR)

Stock of the Day
Mindray Medical International Ltd.
Monday’s Closing Price: MR – $24.95

013007_mr_daily.png

Mindray Medical International Limited engages in the development, manufacture, and marketing of medical devices in China. It offers approximately 40 products through its three segments: Patient Monitoring Devices, Diagnostic Laboratory Instruments, and Ultrasound Imaging Systems. The company’s Patient Monitoring Devices segment primarily offers portable PM-9000 multi-parameter patient monitoring device and approximately 15 patient monitoring devices. The Diagnostic Laboratory Instruments segment offers a range of approximately 10 hematology and biochemistry analyzers that perform analysis on blood, urine, and other bodily fluid samples for clinical diagnosis and treatment. The Ultrasound Imaging Systems segment offers approximately 10 ultrasound imaging systems and it would introduce the color Doppler ultrasound imaging system for use in several clinical areas, such as urology, gynecology, obstetrics, and cardiology. The company sells its products primarily to distributors and directly to hospitals, clinics, government agencies, original design manufacturers, and original equipment manufacturers. It also offers its products in Asia and Europe. Mindray Medical International was incorporated in 2005 and is headquartered in Shenzhen, the People’s Republic of China – Provided by Yahoo Finance

What catches my eye the most about this stock is the number of shares bought and sold during the most recent reporting period! The buy to sell ratio is 39-to-1 which represents institutional accumulation in my opinion and I get warm and fuzzy when these professional buyers support a stock I own (disclosure: I do own shares prior to writing this post). The amount of fundamental data is limited on the young Chinese company but I have listed what I can find using a variety of sources (Yahoo giving me the most data).

Looking at the chart, we can see that the stock is gaining support along the 50-day moving average and is within 15% of a new all-time high (set back in December 2006 at $27.20). The weekly chart shows a flat base that has been forming over the past seven weeks with potential for an up-side breakout. A 200-d m.a. has not formed at this point in time but will be valuable in the future. Overall, I like this young stock and I like the market it comes from.

Here is an insert from a recent SFO magazine article:
Are Communists The World’s Best Capitalists?
by: Jim Trippon

How China has become a driving force in today’s marketplace.

“Find the Stars
I feel the key to success is to buy good companies. I recommend companies that will participate in the best of the Chinese growth story without exposing investors to undue risk. In the long run, I believe the Chinese big cap/value market will bounce above worldwide indices because of the continued growth of both internal and external consumer markets. Many blue-chip Chinese companies pay regular and reliable dividends. Substantial and dependable dividend payments have a soothing way of leveling out the bumps in a volatile market. A solid dividend, sometimes as high as seven percent, helps take the sting out of market volatility.”

013007_mr_weekly.png

Sector: Health Care
Industry: Health Care Equipment
52wk Range: 15.20 – 27.20

Institutional Numbers:
Money Market: 21
Mutual Fund: 75
Other: 4

Shares Bought Last Period: 6.4 million
Shares Sold Last Period: 0.2 million

Value of Shares Bought: $156.4 million
Value of Shares Sold: $4.9 million

Top Holder: Emerging Markets Management LLC
2.1 mil Shares for 0.20% of Portfolio
Total Equity Value of Portfolio: $3.2 billion

Available Fundamental Numbers:
Market Cap.: $1.33bb
P/E (ttm): 59.1
PEG Ratio: 1.42
Profit Margin (ttm): 24.68%
Operating Margin (ttm): 26.31%
Qtrly Revenue Growth (yoy): 21.60%
Qtrly Earnings Growth (yoy): 131.00%
Total Cash: 37.45M
Total Cash Per Share: 0.354
Total Debt: 5.55M
Total Debt/Equity: 0.021
Current Ratio: 6.712
Book Value Per Share: 2.539
Operating Cash Flow : 60.14M

Earnings:
Yearly (2007): 0.59E
Yearly (2006): 0.47E
Yearly (2005): 0.29

Revenue (millions):
Yearly (2007): 269.15E
Yearly (2006): 190.03E
Yearly (2005): 134.9

Growth Estimate (Next 5 years):
35.1%

Support at the 200-day Moving Average

The CANSLIM type stocks listed below are all familiar with their roles of market leadership within the past twelve months but they share another trait:

They are currently trading near support at their respective 200 day moving averages.

012607_hoc_weekly.png

Watching these stocks will also give us a clue to the overall market health as many of them have held support above the long term moving average over the past two years. It will be a major red flag to bulls if several of these stocks break support below the 200-d m.a. on above average volume and then fail to recover the line. Ultimately, the price and volume of the NASDAQ and other major indexes will give us the clue to a market breakdown but these stocks may send the red flags earlier putting us into defense mode. If they don’t breakdown, grab shares when you can along the 200-d m.a. and pyramid your profits higher.

012607_forr_weekly.png

Use the peaks and valleys of the former price swings to develop risk/reward ratios to set stops, targets and position size your trades. Trade these types of stocks like a mechanical system and you will profit over the long term without much effort or concern. These guys have institutional support, so trade the trend until it breaks!

012607_gigm_weekly.png

012607_grmn_weekly.png

012607_hans_weekly.png

012607_ise_weekly.png

012607_jec_weekly.png

012607_ldsh_weekly.png

012607_lrcx_weekly.png

012607_mdr_weekly.png

012607_nue_weekly.png

012607_oii_weekly.png

Enjoy the Weekend!

NMX purchases 19% Stake in OPBL

Price and volume were telling the story long before the announcement yesterday. I didn’t see the action in OPBL because I shy away from lower priced stocks but it’s just another classic example showing how technical analysis beats news to the punch! Fundamental analysis could have also clued in an investor as sales and earnings were increasing but the up-trend and huge volume were the ultimate clue.

012307_opbl_minutes.png

I only found out about this story because I am shareholder in NMX and I get news stories sent to my inbox. Take a look at the charts in this blog entry and study how “someone” knew something was going to happen. “Someone” always knows before the news hits the street.

For more about market news, technical analysis and fundamental analysis, see this entry: Do Not use Fundamental Analysis Alone!

BRIARCLIFF MANOR, N.Y., Jan. 22 /PRNewswire-FirstCall/ — Optionable, Inc. (OTC Bulletin Board: OPBL) a leading provider of natural gas and other energy derivatives brokerage services, announced today that it and three of its founding stockholders have executed a binding term sheet for an agreement with NYMEX Holdings, Inc. (NYSE: NMX “NYMEX”) concerning certain cooperative technology initiatives, the acquisition of a 19 percent stake in Optionable by NYMEX from its three founding stockholders and the issuance to NYMEX of a warrant which would permit it to increase its stake.

012307_opbl_daily.png

012307_opbl_weekly_sm.png

About Optionable
Optionable, Inc. is a leading provider of natural gas and other energy derivatives trading and brokerage services, headquartered in Briarcliff Manor, NY. The company provides its services to brokerage firms, financial institutions, energy traders and hedge funds nationwide. In addition to the traditional voice brokerage business, Optionable developed an automated derivatives trading platform. OPEX® is a real-time electronic trade matching and brokerage system designed to improve liquidity and transparency in the energy derivatives market. For more information about Optionable and OPEX please visit www.optionable.com.

About NYMEX Holdings Inc.
NYMEX Holdings, Inc. is the parent company of the New York Mercantile Exchange, Inc., the world’s largest physical commodity exchange. NYMEX offers futures and options trading in energy and metals contracts and clearing services for more than 250 off-exchange energy contracts.

012307_nmx_daily.png

Through a hybrid model of open outcry floor trading and electronic trading on CME Globex® and NYMEX ClearPort®, NYMEX offers crude oil, petroleum products, natural gas, coal, electricity, gold, silver, copper, aluminum, platinum group metals, and soft commodities contracts for trading and clearing virtually 24 hours each day.

Jones Soda Company JSDA

Stock of the Day
Jones Soda Co.
Friday’s Intra-day Price: JSDA – $13.08

011907_jsda_weekly_sm.png

Jones Soda is a lower priced sister stock of Hansen Natural (HANS) which has the potential to make a nice move and a possible up-trend in 2007. The ideal entry area is along the 200-d m.a. with shorter term entry points along the 50-d moving average or above $10.50 on the point and figure chart. I have shaded an area in blue on the weekly chart that interests me for establishing a position as long as the overall market maintains some strength. The stock is currently extended for a buy so I don’t own shares and haven’t taken a position in the MSW Portfolio. Jones debuted on the MSW Index on January 6, 2007 at $11.73 with analysis similar to what I just wrote above.

The overall market has started to flash sell signals so I am not as aggressive in my buying until I know what is going on. Many recent leaders are falling on heavier volume so this raises red flags in my book!

Jones Soda (JSDA) has been featured on two blog posts over the past Six Months:

December 18, 2006
Stock Predictions for 2007 – Oh NO!

“JSDA – 10.03, as mentioned last week, Jones is a low priced sister stock of Hansen Natural (HANS) which has potential of a nice move and possible up-trend in 2007. The Ideal entry area is along the 200-d m.a. with shorter term entry points along the 50-d m.a. and above $10.50 on the point and figure chart”

– The stock is up more than 30% since this blog post on December 18, 2006.

August 18, 2006
Ten Stocks under $10

“JSDA – 7.80, risky as it tests its 200-d m.a. The sister stock of HANS may have downward pressure if Hansen Natural continues to stumble below its 200-d m.a. Stocks move in packs so be wary if HANS breaks down further”

– This would have been the ideal time to buy as it was near the yearly low but I never picked up shares at this juncture because HANS scared me away as it was breaking below the 200-d m.a..

Jones Soda markets and sells its Jones Soda, Jones Naturals and Jones Energy brands through its distribution network in select markets across North America. A leader in the premium soda category, Jones is known for its innovative labeling technique that incorporates always-changing photos sent in from its consumers. Jones Soda products are sold through traditional beverage retailers and everywhere you’d never expect to find a soda.

Next Earnings Date: 3/8/2007
Sector: Consumer Staples
Industry: Beverages – Soft

Stat: Value of $10,000 invested five years ago: $146,941 today

Held by Institutions: 1.78%
Money Market: 57
Mutual Fund: 70
Other: 3

Top Holder: Vardon Capital Management, LLC
2.1 mil Shares for < 0.57% of Portfolio Total Equity Value of Portfolio: $755.0 million *The top Institutional Holder (Barclays Global Investors UK Holdings Ltd) for HANS is the number 5 largest institutional holder for JSDA with 500k shares Key Fundamental Numbers:
Market Cap.: $331 mil (1/10th of HANS)
Outstanding Shares: 25.42mm
Short Ratio: 22.35
Operating Margin: 8.46
Net Income $M: 3.09
ROA (%): 11.20
ROE (%): 13.69
P/E (TTM): 88.86
P/E (Forward): 93.30 (extremely high)
Price to Sales Ratio: 8.65
Earnings per Share (EPS) (TTM): 0.14
Book Value per Share: 0.29
Price to Book Ratio: 8.16

PEG Ratio: 3.11 (much too high for my liking – I target stocks with a PEG below 1.00 and the lower the better).

What is a PEG Ratio?
A stock’s price/earnings ratio divided by its year-over-year earnings growth rate.
Anything below 0.5 is considered excellent

011907_jsda_daily.png

Next Quarter 0.01
Next Year 0.08

Earnings:
Yearly (2006): 0.08E
Yearly (2005): 0.06
Yearly (2004): 0.06
Yearly (2003): 0.02
Yearly (2002): -0.06

Revenue (millions):
Yearly (2005): 33.51
Yearly (2004): 27.45
Yearly (2003): 20.10
Yearly (2002): 18.57

3-Year Sales Rate (growth): 24%

Net Income:
2005: 1.28
2004: 1.33
2003: 0.32

Cash Flow:
2005: 1.50
2004: 1.52
2003: 0.50

The fundamental numbers of JSDA are not in the same league as HANS but the chart does catch my attention. If HANS makes another run, JSDA and FIZ may tag along for the ride. If a risk/reward ratio of 3:1 or better develops, I will grab shares and!