Trader Vic 1-2-3 Setup?

Clean Harbors (CLHB) looks to be setting up a 1-2-3 pattern as described in the book Methods of a Wall Street Master by Victor Sperandeo.

As you can see:

  • CLHB broke the up-trend after establishing a new 52-week high.
  • From there, it consolidated and formed what is referred to as the minor sell-off.
  • Prices stared to rise but failed to make another new high. This test of the previous high failed near point number 2.
  • A failure to make a new high is usually (not always) a signal that the trend is about to change.
  • Finally, we reach point number 3 where prices went below the previous short term minor sell-off

However, prices didn’t continue to fall below this area so the position would still be established from the original penetration point. New investors should be looking for another penetration of the prior minor sell-off.

092607_clhb_wkly.png

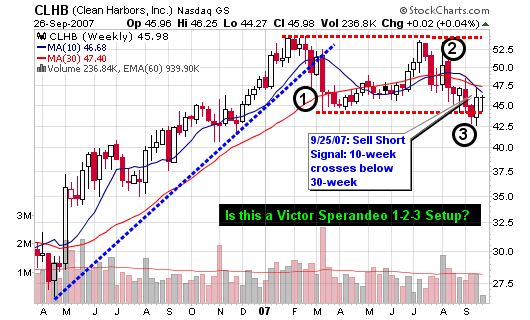
In addition to the 1-2-3 setup, the stock has also allowed it’s 10-week moving average to cross below the 30-week moving average which typically signals a change in trend when both lines are starting to point down.

Potential Trade Set-up:
Ideal Entry (short position): $45.00 (right now below the moving averages)
Risk is set at 1.0% maximum of total portfolio or $1,000 of $100k
Stop Loss is 6% or $47.70 (above moving averages)
Number of Shares: 370
Position Size is $16,650
Risk is $2.70
Target is $40 or less
Reward-to-Risk is about 2-to-1 (the target is a guess but I prefer at least a 3-to-1)

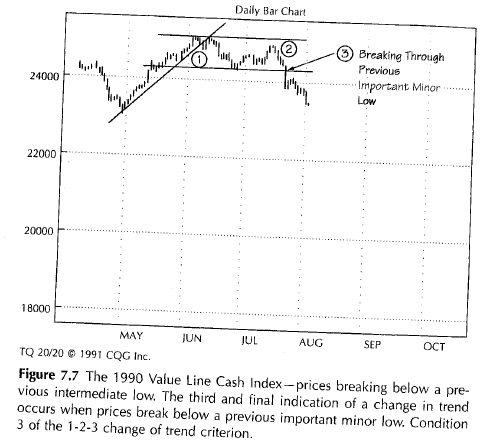
Victor Sperandeo says this about the 1-2-3 setup:

At the point where all three of these events have occurred graphically, there exists the equivalent of a Dow Theory confirmation of a trend change. Either of the first two conditions alone is evidence of a probable change in trend. Two out of three increases the probability of a change in trend. And three out of three defines a change in trend.

Take a look at the picture I scanned from Sperandeo’s book on page 76:

092607_123_book.png

So, I’ll take the trade and see what happens. It can go up and whipsaw me out of the position but I have my stop and risk established so it won’t hurt the overall portfolio.

This is a game of odds with developed expectancies so take the trades and follow the rules.

Petrochina (PTR) Climax Top?

Are we watching a climax top in Petrochina (PTR)?

If so, now is the time to dump shares and protect profits. So, you don’t want to dump them all; then sell half or at least a third of your position.

092507_ptr_daily.png

I have been taught to always sell all of a stock that has a climax top – this is where the stock has advanced for many months and suddenly races up for one or two weeks much faster than any prior one- or two-week period or since the beginning of the stock’s long move up). Petrochina is currently experiencing a dramatic push unlike any of the previous tops it has made over the past couple of years.

Another rule I follow explains that you should sell when your stock exceeds an upper channel line drawn across three price peaks over a period of many months on a weekly chart. We can clearly see that PTR is now violating the upper trend channel after it touched three prior price peaks.

092507_ptr_wkly.png

I can’t tell anyone what to do and I don’t want to either but I love presenting what I see based on technical analysis. PTR was a buy for me in February but I now see it as a sell.

What do you see?

Donchian’s 5 and 20 day Moving Averages

Richard Donchian is known as the father of trend following. His original trend following ideas form the basis for all trend following success that has followed. Below in an excerpt from an article written in 1995 about his 5 and 20 day moving average system:

Title: Donchian’s five- and 20-day moving averages.
Author: Richard Donchian
Publication: Futures (Cedar Falls, Iowa) (Magazine/Journal)
Date: November 15, 1995
Publisher: Oster Communications, Inc.
Volume: v24 Issue: n13 Page: p32: ISSN: 0746-2468

BODY:
On Wall Street there are two conflicting adages:
1. “You’ll never go broke taking a profit.”
2. “Cut your losses short and let your profits ride.”

Experience has shown that in commodities trading, the first of these “old saws” is dangerous and misleading, while the second may well be regarded as the one lesson the inexperienced commodity trader should learn if he wishes to have a better-than-even chance to come out ahead.

Every well-designed, trend-following, loss-limiting method for trading in futures (or stocks) rests on the basic principle that a trend in either direction, once established, has a strong tendency to persist, at least for a time. Among the many trend-following approaches now in use are the Dow Theory, point-and-figure chart techniques, swing methods (other than the Dow Theory), trendline methods, weekly-rule methods and moving average methods. We’ll focus on moving average methods and, in particular, the comparatively simple five- and 20-day moving average method.

The Method
The rules for the five- and 20-day moving average method break down into two categories: general and supplemental.
General rules:

[Read more…]

What is Realtive Strength

I received a question about Relative Strength (RS) in the comments of a recent post.

I have spent many hours reading and studying your blogs; best on the web! I am very anxious to see your new site. In the meantime, I have a question about relative strength. I have a mild understanding of relative strength based on my own research but can you explain RS in more detail especially the meaning and importance of RS numbers and how they fit into an investor’s strategy. For me, your post on January 22, 2006 that looks at Coach (COH) and Tower Group (TWGP) would be a good place to begin.

Thank you. Keep up the good work.

Paul Trombley

Paul,
Relative Strength (RS) is calculated by dividing the stock’s price by the value of a specific index (the S&P 500 in the case of IBD). It is also a measure of price trend that indicates how a stock is performing relative to other stocks in its industry.

The RS line is helpful in determining whether a stock is outperforming or lagging the general market and/or it’s industry peers.

A new relative strength high may be an indicator that a stock is prepared to make a new price high and a new relative strength low that precedes a new low in the stock can be a warning sign that a stock is in trouble and possibly going lower. (This is what I detailed in the COH and TWGP posts in early 2006).

*Today’s Top 10 RS Stocks are Listed at the Bottom of the Post (with Charts)*
[Read more…]

Examine Rochester Medical

Stock of the Day – Update
Rochester Medical (ROCM)

Monday’s Closing Price: ROCM – $16.44

Sector: Health Care
Industry: Health Care Supplies
52-week Price: $6.85 – $29.76

Well, ROCM is now up almost 20% from its low last week and I don’t own shares!

Why? I had to sell based on my setup. See the trade setups below which turned out to be WRONG. I COMPLETELY understand why they were wrong and it was staring me in the face the entire time; after Dankkir noted the un-filled gap on the charts that I essentially ignored. Well, if we waited more patiently and placed the position when the gap filled, we would still be holding into today’s action with an approximate gain of 16% and earnings due to be released after the market close. I can’t tell you if I would have held through earnings today.

I made a mistake, closed my loss and went back and studied what I did wrong. Therefore, I will be prepared to look for these things in the next opportunity. I placed my first trade over 10 years ago but I still make small careless mistakes but the most important thing was that I didn’t allow it to hurt me! I followed my rules!

073107_rocm_wkly.png

This should have been the ideal trade setup:
Ideal Trade Set-up:
Ideal Entry: $14.14 (area where gap was closed)
Risk is set at 1.0% maximum of total portfolio or $1,000 of $100k
Stop Loss is 8% or $13.01 (below the gap area)
Number of Shares: 884
Position Size is $12,500
Risk is $1.13
Target is $21
Risk-to-Reward is 6-to-1

Potential Trade Set-up #1 – WRONG!:
Ideal Entry: $15 (currently $15.14)
Risk is set at 1.0% maximum of total portfolio or $1,000 of $100k
Stop Loss is 5% or $14.25
Number of Shares: 1,333
Position Size is $20,000
Risk is $0.75
Target is $21
Risk-to-Reward is 8-to-1

Potential Trade Set-up #2 WRONG!:
Ideal Entry: NOW (currently $14.75)
Risk is set at 1.0% maximum of total portfolio or $1,000 of $100k
Stop Loss is 5% or $14.01
Number of Shares: 1,356
Position Size is $20,000
Risk is $0.74
Target is $21
Risk-to-Reward is 8-to-1

*This trade setup could have worked with a 10% stop loss.*