Listen to your System

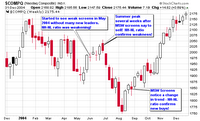
As I highlighted in the blog post yesterday, my system alerted me that the market was going to take a turn south in the summer of 2004 and it did (May, June and July). It is important for every trader to have your own system that alerts you of moves which allows you to profit. It can be short term, long term or anything in between but you must understand what it is saying. I depend on the price and volume of the major indexes, the NH-NL ratio and the action among the individual leaders to determine if the market is strong or weak. Since I have studied these patterns for years, I know when the market is moving higher or lower based on the confirmations each of these indicators give me. Nothing is exact but they are extremely accurate as they guide me with test buys, position sizing my trades and moving me to the sidelines.

Take a look at how these three major indicators got me in and out of the market in 2004 (and keep in mind that I am not a day trader – I was momentum trading, trend trading and swing trading in 2004 – which ever you would like to call it).

I wrote this entry on my Weekly Screens on April 19, 2004 (the highs on the NASDAQ in April 2004 were not revisited until November of that year):

Market Overview: The market is still in a confirmed rally according to rules but we are seeing many stocks hesitate and undecided about their direction. The world situation has been a big influence on the general market conditions. Speculation of an interest rate hike has kept the market in flux.

My screens showed bad news last week with the daily new highs and lows. For the first time since posting my screens in November (2003), the daily new highs were lower than the daily new lows. I haven’t seen action like this since the bear market.”

I posted a weekly screen insert in yesterday’s blog post from July 2004 which warned that the market was still heading lower. The MSW screens turned negative in May 2004 and stayed that way until late August 2004 as you will read below.

WEEKLY OVERVIEW of 8/16/04 to 8/20/04:

“…However, I am possibly seeing a new trend that may be starting to form in the indexes. You heard it here first. I may be early but I am seeing a change in my screens. (Please note, I saw the trend in March of 2003, especially April of 2003 – I posted in real time on this breakout simultaneous with IBD). I was tipped off by the “new highs vs. new lows” combined with the huge institutional sponsorship that was sending stocks to new highs.

The DOW was up just short of 3% from Friday (13th) to this past Friday (20th)
The NASDAQ was up 4.5% in the same time period
I have noted that volume was extremely weak.

The New Highs vs. New Lows picture looked different than past weeks.
We had 3 days out of 5 that had more new highs.

On 8/13, we had – NH-37, NL-304
On 8/20, we had – NH-128, NL-53

I know this is minor but it may be the first signs of a changing atmosphere. Stayed tuned as I will keep a close eye on this change in my screens. (I have done my daily analysis for Monday, August 23, and I see more encouraging signs in the NH vs. NL list: 131 vs. 46). Again, volume was weak. When the charts and volume cooperate with the new highs list, we may be half way to a new up-trending market.”

Looking at the chart from 2004, I guided traders out near the top of the early summer decline and I guided them back in at the beginning of the late summer/ fall advance.

More recently, I took investors out of the market in mid May 2006 and hope to have them back in when my screens confirm the rally in the future. When will that be? I don’t know but my research will tell me as it has every time in the past.

If you would like to review my work on the MSW screens, I invite you to explore my past archives from 2004 and 2005 as they are open to the public. You can review a chart as you read everything I have written over the past two years. The archives for 2006 are for members only but will open to the public when the year ends. Using my three main indicators, I have been very successful by getting in and out of the market since late 2002. Prior to 2002, my system was not as strict as it is today but I learned my lesson by getting slammed in 2001.

Develop a system, hone that system and understand what it is trying to tell you and you will come out with a profit. Every trade can’t be a winner but you won’t be fighting the trend because your overall system will tell you what side of the market to trade.

Piranha
Consider Timing when Buying a Stock

NutriSystem (NTRI) shares are up more than 13% today after the provider of weight-loss products beat Wall Street’s earnings expectations and offered a better-than-anticipated outlook. Last year, the company lost $605,000 or 2 cents a share in the fourth quarter. This year, the company posted a Q4 income of $6.3 million, or 17 cents a share, beating estimates by $0.01 as analyst were looking for earnings to come in at $0.16 a share. Revenue also jumped considerably from $7.9 million to $69.7 million (analysts expected $69.5 million).

Looking ahead, NTRI predicts earnings of $0.40 to $0.42 cents a share while analysts predict $0.37 (a main factor weighing into the 13% jump in earnings today). Company projections for revenue also come in higher than analyst’s projections ($122 – $127 million versus $117 million). This is the big difference between a stock like (NTRI) and (RNOW). RNOW also crushed earnings a couple of weeks back but the future expectations came in lower than analysts projections so the stock did not breakout. For further analysis on the RNOW failed breakout, see this blog post.

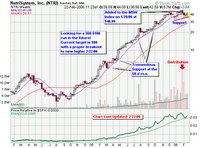
On 1/28/06, I added (NTRI – $46.99) to the MSW Index and said this:
“Added to the Index after it broke out above $45. The stock traded sideways for nine weeks in what I call a consolidation. It reminds me of HANS and TS when they made their great runs from the single digits to $100 per share. Target is $80 in six months.”

Two weeks later, the stock violated the MSW Index 10% mandatory sell rule so it was removed officially from the Index BUT I said this and kept it in it’s spot on the Index (unofficially as a watch candidate):

Analysis from Weekly Screen on 2/11/06 (NTRI – $38.95):
“The stock was a sell for anyone that bought at the former levels but I am not convinced in removing it from the Index because I see some support. Technically it is removed from the MSW Index as I have removed the date and % gain/loss. It has a chance to officially re-enter the MSW Index if it sets up another buying opportunity.”

This past Saturday, I went on to support my original feeling that this stock was receiving support and I may still be wrong but today’s 13% jump supports my original analysis:

Analysis from Weekly Screen on 2/18/06 (NTRI – $38.96):
“Down a penny this week as I will allow the stock to stay on the MSW Index as a watch candidate (not a buy candidate at this time). Some investors actually look at this stock as a shorting candidate and they may be right but I am not in that boat right now. I still see the possibility of a move higher after this sideways correction phase is over. Time will tell (for now – watch from the outside).”

What is the moral of this post?

Sometimes you may find a stock and research it and discover that it has upside potential and buy but get in at the wrong time. You may be forced to sell but that doesn’t mean that your original analysis was wrong. Don’t give up just yet, hang tight, take the small loss and watch the stock on the side to see if your timing was wrong. If the timing was wrong and the stock is acting strong again, place another position and follow the rules (especially your sell rules). If it violates the rules again, sell for another small loss. If it takes off and shows a profit, you will be very happy that you didn’t miss out on a big winner because your first trade was placed at the wrong time.

Over the next few weeks and months, we will see if NTRI will make the next run I originally anticipated!

Piranha

Determine a Stock’s Price target

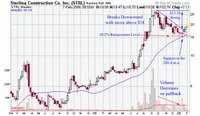
On Saturday, I added Sterling Construction Company (STRL) to the MSW Index as a non-traditional play. Why is it non-traditional for MSW? Because it was not breaking into new high territory as we screened it onto the Index. I said:

“This is not a typical MSW Index play but I see up-side potential on the chart after the correction in the $20 range and the support at the moving average. The down-trend was also broken as I will show you on the MSW Index charts. Rating: Buy (target is $30 in 2006)”

After giving a target price, I was questioned by a member as to how I came up with $30. I don’t teach how to develop price targets because there are many methods and none of them are extremely accurate and some vary greatly with their predictions. I don’t want to give false hope with a price target and I definitely don’t want to get sued by a member that believes a stock is going to reach a certain point based on my analysis. I run an equity research and education site, not an analyst firm so I am more concerned with finding stocks with the potential to move higher based on fundamental and technical analysis and not price targets (or upgrades and downgrades).

The stock entered the MSW Index at $18.93 on 2/4/06 with support at the 200-d m.a. I will show you two methods I use to develop price targets and then tell you why I picked $30 as a possible target based on the information provided by the two methods.

The first method to determine if the stock had bottomed is the use of the Fibonacci retracement levels (in this case, the 38.2% retracement which equals $15.46). It turns out that this retracement level also corresponds with the 200-d m.a. support and lifted the stock higher. Turning to the retracement level on the positive side, the method predicts a top at three common locations:
61.8%: $23.26
50.0%: $21.13
38.2%: $20.13

I also use another method that I first learned about in Stan Weinstein’s book “Secrets for Profiting in Bull and Bear Markets” called the swing method. This method takes the peak number ($28.35) and subtracts the bottom number ($15.05) to give us a swing number of $13.30. This was the size of the correction of the swing from $28.35 to the bottom at $15.05. Weinstein states that you take the swing number ($13.30) and add it to the peak number ($28.35) to give you a price target of $41.65. You can read more about this in chapter 6 of the book.

I now have two price targets that are completely different:
Fibonacci 61.8% retracement of $23.26
Weinstein swing method of $41.65

My target of $30 was developed by looking at the pattern and determining that the stock will most likely top near $30 if the former 52-week high is surpassed. The Weinstein method is accurate with CANSLIM type stocks and the Fibonacci method is very accurate when determining a pullback area.

Bottom line: everything is just a guess based on a certain set of parameters and information. No one truly knows where it will go. Place the position, set a sell stop slightly below the moving average and see what happens. If the stock gains more than 25% in the first few weeks, place a trailing stop to protect profits. Follow the rules and you will make money on winning trades and lose small amounts on losing trades. In the end, it should work out in your favor if you place several trades throughout the year. Several winning trades and several losing trades but the winners should be larger than the losers, keeping your portfolio in the black!

Piranha

Tight Weekly Closes

…I was recently asked about a chart pattern that boasts tight closes at some point in an uptrend. William O’Neil actually named a pattern after this type of market action “three weeks tight”. As I mentioned, the pattern usually forms as the stock has already broken out of the original base. The pivot point is usually long gone but this pattern allows the investor to establish a new position or add to the first position.

You must use a weekly chart to see this pattern as the daily charts will have too much volatility and unnecessary noise that will only confuse you. Look for a stock that has strong fundamentals and has started to stall, closing in a very tight range for at least three weeks. The price will close at almost the exact same point each of the three weeks.

The stock may swing from its weekly high to its weekly low intraday but the most important number is the close at the end of the day on Friday. Make sure the stock doesn’t break any long term support lines such as the 50-d or 200-d moving averages. If the volatility is not excessive, the buy can be considered. After the stock closes the final week (week #3), you may add a new position but make sure you buy a smaller amount of shares than you would at the proper pivot point. If the trade turns bad, always sell and sell fast, cut all losses at a maximum of 7% on this pattern.

Always keep in mind that tight closes in both the daily and weekly charts may provide a clue that institutional investors are buying up shares as the weak investors bail. These institutional investors are holding up the stock as the three week pattern forms.

Another similar pattern is the “railroad-track pattern” which typically occurs near the top of a climax run. If the stock closes the week slightly higher on above average volume, issue a mental red flag. On the weekly chart, this pattern will resemble railroad tracks by closing with two parallel vertical lines. The three week tight pattern is positive while the railroad track pattern is usually negative.

Piranha