The New High-New Low Ratio (NH-NL) crossed into neutral territory for the first time since early October 2006. It then briefly stopped in negative territory for the weeks ending March 10 and March 17, the first time this happened since August 2006. The ratio has been volatile with direct relation to the large up and down swings of the market so don’t read too much into that action. I am watching to see if the ratio can hold steady and maintain some strength near the 60% level without dropping back to negative territory. The streak of higher highs and higher lows is now over and the consolidation phase from October to February has been snapped to the downside. The first red flag has been signaled with the violation of the support level so now look for additional red flags such as any trend that develops making lower highs and lower lows on a consistent basis.

Keep in mind, it was March and April 2006 that started the steak of weakness last year in this ratio and the market as a whole.
Weekly New High – New Low Ratio (NH-NL) for 2007:
Saturday, January 6, 2007: 279-67
Saturday, January 13, 2007: 344-39
Saturday, January 13, 2007: 281-46
Saturday, January 27, 2007: 316-55
Saturday, February 3, 2007: 502-45
Saturday, February 10, 2007: 558-53
Saturday, February 17, 2007: 428-48
Saturday, February 24, 2007: 556-42 – This past week (a short week)
Saturday, March 3, 2007: 187-130
Saturday, March 10, 2007: 96-125
Saturday, March 17, 2007: 114-145
Saturday, March 24, 2007: 284-53
Saturday, March 31, 2007: 227-68
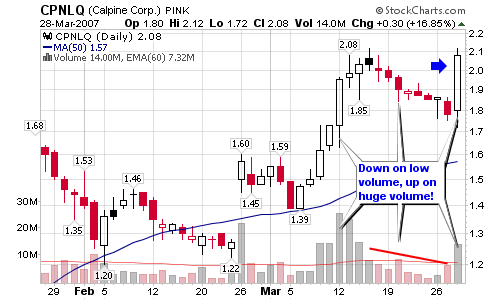
Below is the latest action among the industry groups I follow to gauge market strength from one area to another:


Connect with Me