NMX purchases 19% Stake in OPBL

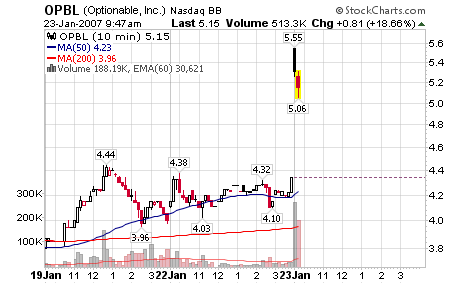
Price and volume were telling the story long before the announcement yesterday. I didn’t see the action in OPBL because I shy away from lower priced stocks but it’s just another classic example showing how technical analysis beats news to the punch! Fundamental analysis could have also clued in an investor as sales and earnings were increasing but the up-trend and huge volume were the ultimate clue.

012307_opbl_minutes.png

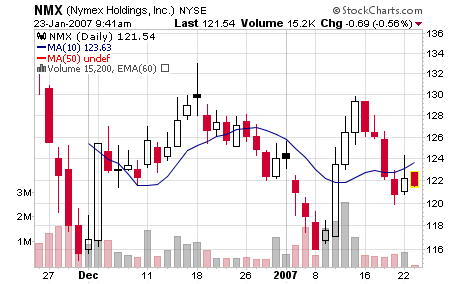
I only found out about this story because I am shareholder in NMX and I get news stories sent to my inbox. Take a look at the charts in this blog entry and study how “someone” knew something was going to happen. “Someone” always knows before the news hits the street.

For more about market news, technical analysis and fundamental analysis, see this entry: Do Not use Fundamental Analysis Alone!

BRIARCLIFF MANOR, N.Y., Jan. 22 /PRNewswire-FirstCall/ — Optionable, Inc. (OTC Bulletin Board: OPBL) a leading provider of natural gas and other energy derivatives brokerage services, announced today that it and three of its founding stockholders have executed a binding term sheet for an agreement with NYMEX Holdings, Inc. (NYSE: NMX “NYMEX”) concerning certain cooperative technology initiatives, the acquisition of a 19 percent stake in Optionable by NYMEX from its three founding stockholders and the issuance to NYMEX of a warrant which would permit it to increase its stake.

012307_opbl_daily.png

012307_opbl_weekly_sm.png

About Optionable
Optionable, Inc. is a leading provider of natural gas and other energy derivatives trading and brokerage services, headquartered in Briarcliff Manor, NY. The company provides its services to brokerage firms, financial institutions, energy traders and hedge funds nationwide. In addition to the traditional voice brokerage business, Optionable developed an automated derivatives trading platform. OPEX® is a real-time electronic trade matching and brokerage system designed to improve liquidity and transparency in the energy derivatives market. For more information about Optionable and OPEX please visit www.optionable.com.

About NYMEX Holdings Inc.
NYMEX Holdings, Inc. is the parent company of the New York Mercantile Exchange, Inc., the world’s largest physical commodity exchange. NYMEX offers futures and options trading in energy and metals contracts and clearing services for more than 250 off-exchange energy contracts.

012307_nmx_daily.png

Through a hybrid model of open outcry floor trading and electronic trading on CME Globex® and NYMEX ClearPort®, NYMEX offers crude oil, petroleum products, natural gas, coal, electricity, gold, silver, copper, aluminum, platinum group metals, and soft commodities contracts for trading and clearing virtually 24 hours each day.

How to Calculate a Stock’s Pivot Point

The basis of this article stems from the teachings of William O’Neil and his CANSLIM acronym.

Stocks breakout from properly formed bases everyday but many investors don’t understand how to locate a pivot point or what patterns to study that may contain this very important buy signal. A pivot point can be described as the optimal buy point or the area at the end of a familiar base pattern where the stock breaks out into new high territory. William O’Neil, the founder of Investor’s Business Daily is considered the pioneer of the pivot point in modern times. As Jesse Livermore explains in his book (1941), the pivot point can also be described as the point of least resistance. When a stock breaks the point of least resistance, we are presented with an opportunity where a stock has the greatest chance of moving higher in a short period of time, especially when volume accompanies the breakout.

051105_dpz_cup_w_handle_sm.jpg

The pivot point can be calculated as the stock is forming the handle on a cup-with-handle base. The ideal buy price would be $0.10 higher than the highest spot during the handle, also know as the top of the right side of the base. The intraday high can qualify at the highest point and does not have to be the closing price of the stock. If the stock closes at the high for the day, then we will use this number as the high point.

The exact methods used for finding pivot points vary depending on the base pattern that is forming on a daily and/or weekly chart.

When a flat base occurs, an investor should look for a move $0.10 higher than the top point on the left side of the base or the start of the formation.

A saucer-with-handle follows the same rules as the cup-with-handle and is described in detail above.

A double-bottom formation triggers a pivot point that will be $0.10 higher than the middle peak in the “W” shaped pattern.

081704_uci_saucer_w_handle_sm.jpg

Many investors will try to cheat the rules and place a position prematurely before the stock breaks out and passes the pivot point. I do not suggest buying until the stock triggers the pivot point on above average volume also known as qualifying volume. The area considered as the least amount of resistance is weighed so heavily because all overhead sellers are gone as we break into new high territory. The pivot point usually comes within 5% to 15% of the stock’s old high 52-week high.

Don’t chase a stock that is 5% or more above the proper pivot point. This does not mean that you can’t buy on normal corrections and pullbacks to support or moving averages, especially if the stock remains in an uptrend. This rule only applies to the pivot point area as the stock becomes extended. If you buy with the pivot point and sell when a stock falls 5-10% from the pivot point, I guarantee that your yearly performance will increase dramatically. However, your risk must stay within 1-2% maximum of total portfolio value and risk-to-reward ratio should be at least 2.5:1.

How to Look for a Cup with Handle (chart #1):
Look for relatively quiet volume as the stock builds the left side of the cup. Volume at the base of the cup should be slightly higher than the left side as support is coming into the stock. The right side of the base should have above average volume with more up-days than down days. The handle will be the last part of the formation and should slope slightly downward with lower volume than the right side of the base. The pivot point will be slightly higher than the highest point of the right side of the base. All breakouts should occur on volume 100% greater than average daily volume although IBD does say that breakouts above 50% do qualify.

How to Look for a Saucer with Handle (chart #2):
Look for relatively quiet volume as the stock builds the left side of the saucer. A saucer looks similar to the cup-with-handle but the dip from the high to the low is smaller and usually longer in duration. Volume at the base of the saucer should be slightly higher than the left side as support is coming into the stock. At this point, the base may almost qualify as a flat base. The right side of the base should have above average volume with more up-days than down days but this does not have to be as prominent as the cup-with-handle. The handle will be the last part of the formation and should slope slightly downward with lower volume than the right side of the base. The pivot point will be slightly higher than the highest point of the right side of the base. All breakouts should occur on volume 100% greater than average daily volume.

Jones Soda Company JSDA

Stock of the Day
Jones Soda Co.
Friday’s Intra-day Price: JSDA – $13.08

011907_jsda_weekly_sm.png

Jones Soda is a lower priced sister stock of Hansen Natural (HANS) which has the potential to make a nice move and a possible up-trend in 2007. The ideal entry area is along the 200-d m.a. with shorter term entry points along the 50-d moving average or above $10.50 on the point and figure chart. I have shaded an area in blue on the weekly chart that interests me for establishing a position as long as the overall market maintains some strength. The stock is currently extended for a buy so I don’t own shares and haven’t taken a position in the MSW Portfolio. Jones debuted on the MSW Index on January 6, 2007 at $11.73 with analysis similar to what I just wrote above.

The overall market has started to flash sell signals so I am not as aggressive in my buying until I know what is going on. Many recent leaders are falling on heavier volume so this raises red flags in my book!

Jones Soda (JSDA) has been featured on two blog posts over the past Six Months:

December 18, 2006
Stock Predictions for 2007 – Oh NO!

“JSDA – 10.03, as mentioned last week, Jones is a low priced sister stock of Hansen Natural (HANS) which has potential of a nice move and possible up-trend in 2007. The Ideal entry area is along the 200-d m.a. with shorter term entry points along the 50-d m.a. and above $10.50 on the point and figure chart”

– The stock is up more than 30% since this blog post on December 18, 2006.

August 18, 2006
Ten Stocks under $10

“JSDA – 7.80, risky as it tests its 200-d m.a. The sister stock of HANS may have downward pressure if Hansen Natural continues to stumble below its 200-d m.a. Stocks move in packs so be wary if HANS breaks down further”

– This would have been the ideal time to buy as it was near the yearly low but I never picked up shares at this juncture because HANS scared me away as it was breaking below the 200-d m.a..

Jones Soda markets and sells its Jones Soda, Jones Naturals and Jones Energy brands through its distribution network in select markets across North America. A leader in the premium soda category, Jones is known for its innovative labeling technique that incorporates always-changing photos sent in from its consumers. Jones Soda products are sold through traditional beverage retailers and everywhere you’d never expect to find a soda.

Next Earnings Date: 3/8/2007
Sector: Consumer Staples
Industry: Beverages – Soft

Stat: Value of $10,000 invested five years ago: $146,941 today

Held by Institutions: 1.78%
Money Market: 57
Mutual Fund: 70
Other: 3

Top Holder: Vardon Capital Management, LLC
2.1 mil Shares for < 0.57% of Portfolio Total Equity Value of Portfolio: $755.0 million *The top Institutional Holder (Barclays Global Investors UK Holdings Ltd) for HANS is the number 5 largest institutional holder for JSDA with 500k shares Key Fundamental Numbers:
Market Cap.: $331 mil (1/10th of HANS)
Outstanding Shares: 25.42mm
Short Ratio: 22.35
Operating Margin: 8.46
Net Income $M: 3.09
ROA (%): 11.20
ROE (%): 13.69
P/E (TTM): 88.86
P/E (Forward): 93.30 (extremely high)
Price to Sales Ratio: 8.65
Earnings per Share (EPS) (TTM): 0.14
Book Value per Share: 0.29
Price to Book Ratio: 8.16

PEG Ratio: 3.11 (much too high for my liking – I target stocks with a PEG below 1.00 and the lower the better).

What is a PEG Ratio?
A stock’s price/earnings ratio divided by its year-over-year earnings growth rate.
Anything below 0.5 is considered excellent

011907_jsda_daily.png

Next Quarter 0.01
Next Year 0.08

Earnings:
Yearly (2006): 0.08E
Yearly (2005): 0.06
Yearly (2004): 0.06
Yearly (2003): 0.02
Yearly (2002): -0.06

Revenue (millions):
Yearly (2005): 33.51
Yearly (2004): 27.45
Yearly (2003): 20.10
Yearly (2002): 18.57

3-Year Sales Rate (growth): 24%

Net Income:
2005: 1.28
2004: 1.33
2003: 0.32

Cash Flow:
2005: 1.50
2004: 1.52
2003: 0.50

The fundamental numbers of JSDA are not in the same league as HANS but the chart does catch my attention. If HANS makes another run, JSDA and FIZ may tag along for the ride. If a risk/reward ratio of 3:1 or better develops, I will grab shares and!

Hanson Natural, Is HANS Back?

Stock of the Day – UPDATE!
Hanson Natural
Thursday’s Intra-day Price: HANS – $36.86

011807_hans_weekly_sm.png

HANS has been one of the top performers in both my own portfolio and the MSW Index over the past two years. The stock has been screened more than 50 times on the weekly analysis from 2005 to 2006 and it has been mentioned in a couple dozen blog posts since August 2005. It has made countless daily screens since 2005 and if I had to guess, the number would be between 150 and 200 screens. My first blog on HANS came back on July 11, 2005 and was the start of a long research relationship. Below are a few key blog entries for HANS (some images and charts may be missing because the original files were uploaded to blogger servers and I haven’t recovered and replaced all of those files since moving to WordPress).

May 9, 2006
This “Buds” for HANS

March 13, 2006
Can HANS do it Again?

January 13, 2006
Hansen Natural (HANS) Does it Again

July 11, 2005
Buy High and Sell Higher

Next Earnings Date: 3/8/2007
Sector: Consumer Staples
Industry: Other Beverages

Hansen is recovering the 200-day moving averages for the first time in almost six months and has started to pop back on my fundamental and technical screeners. Last night, the stock made a screen titled “Interesting Stocks within 10% of the 200-d Moving Average”.

I am also following a kid sister stock named Jones Soda (JSDA) which will be profiled here on the blog tomorrow.

Hansen Natural Corporation, through its subsidiaries, engages in the development, marketing, sale, and distribution of beverages in the United States and Canada. It offers natural sodas, fruit juices, energy drinks and energy sports drinks, fruit juice smoothies sparkling lemonades and orangeades, noncarbonated ready-to-drink iced teas, seltzer waters, lemonades, juice cocktails, children’s multivitamin juice drinks, and noncarbonated lightly flavored energy waters. The company also provides vitamin and mineral drink mixes in powdered form. It sells its products primarily under the brand names, including Hansen’s’, ‘Blue Sky’, and ‘Junior Juice’ to retail and specialty chains, club stores, mass merchandisers, full service distributors, and health food distributors. Hansen Natural Corporation was founded in 1985 and is based in Corona, California. – Company profile provided by Yahoo Finance

Amazing Stat: Value of $10,000 invested five years ago: $708,121 today

011807_hans_monthly.png

The stock was only held by 49% (institutional) when I did my first blog case study back in March 2006.

Held by Institutions: 76.75%
Money Market: 215
Mutual Fund: 313
Other: 20

Top Holder: Barclays Global Investors UK Holdings Ltd
15.6 mil Shares for < 0.01% of Portfolio Total Equity Value of Portfolio: $706.0 billion (almost $1 trillion) Key Fundamental Numbers:
Market Cap.: $3.3B
Outstanding Shares: 90.0mm
Short Ratio: 4.21
Operating Margin: 18.36
Net Income $M: 87.98
ROA (%): 45.16
ROE (%): 60.83
P/E (TTM): 43.11
P/E (Forward): 25.23
Price to Sales Ratio: 7.16
Earnings per Share (EPS) (TTM): 0.89
Book Value per Share: 1.41
PEG Ratio: 1.26
Price to Book Ratio: 17.56

Next Quarter 0.27
Next Year 1.11

Earnings:
Yearly (2006): 1.11E
Yearly (2005): 0.65
Yearly (2004): 0.22
Yearly (2003): 0.07
Yearly (2002): 0.04

Revenue (millions):
Yearly (2005): 348.9
Yearly (2004): 180.3
Yearly (2003): 110.3
Yearly (2002): 92.05

3-Year Sales Rate (growth): 56.65%
3-Year Net Income (growth): 180.91%

Net Income:
2005: 62.8
2004: 20.4
2003: 5.93

Cash Flow:
2005: 63.8
2004: 21.2
2003: 6.58

Does HANS have another run for investors?

Can you TRUST Talking Heads, I mean analysts?

I mention the phrase “Talking Heads” on this blog from time to time and I am serious. Most large investment houses get it wrong when it comes to timely stock selections (at least outside of their institutional research departments). When using the phrase “talking heads”, I am referring to analysts and firms on the retail side of the fence.

011707_enron.gif

I have preached that these firms are only looking out for their best interests, not yours. They don’t care about anything but your money; they never look out for the small investor (in my opinion of course)! I wrote a post on my old blog about the coverage of Enron and thought it would be great to update the entry and focus on the “Talking Heads”.

Look below to see how multiple major firms kept sending out buy signals for Enron based purely on fundamental analysis. If they looked at the charts, they would have noticed several breakdowns among every type of chart available (intraday, daily, weekly, monthly, etc…). It didn’t matter what chart you viewed, they all had red flags at every corner and even a novice could have located the correction coming. I am not saying that anyone saw the collapse but simple sell rules should have taken all technical investors out of the stock (I never owned Enron and I am glad).

011707_enron_chart.gif

I have included a condensed summary of the case study based from the Dorsey Wright analysis of the Enron collapse (all research was performed by Dorsey Wright – www.dorseywright.com)
I have no affiliation with Dorsey Wright:

View the entire breakdown through this PDF:
Anatomy of a Collapse – Enron

CBS Market Watch Also provides an excellent long term chart though this Timeline

ENE – Enron

Merrill Lynch:
March 21, 2001: $55.89 Reiterated Near-term “Buy” at Merrill
April 17, 2001: $60.00 Reiterated Near-Term “Buy” at Merrill
August 15, 2001: $40.25 Cut to Near-Term “Neutral” at Merrill
Oct 9, 2001: $33.39 Raised to Long-term “Buy” at Merrill Lynch
Oct 16, 2001: $32.84 Raised to Near-term “Accumulate” at Merrill Lynch
Nov 1, 2001: $11.99 Cut to Near-Term “Neutral” at Merrill
(finally cut after 79% loss – not cut to sell)

Banc of America:
August 15, 2001: $40.25 Reiterated “Strong Buy” at Banc of America
August 28, 2001: $38.16 Reiterated “Strong Buy” at Banc of America
Oct 25, 2001: $16.35 Cut to “Market Perform” at Banc of America
(finally cut after 59% loss – still market perform)

Commerzbank:
March 14, 2001: $62.75 Raised to “Accumulate” at Commerzbank
March 22, 2001: $55.02 Reiterated “Accumulate” at Commerzbank Capital
April 18, 2001: $61.62 Reiterated “Accumulate” at Commerzbank Capital
Nov 9, 2001: $ 8.63 Cut to “Hold” at Commerzbank
Nov 28, 2001: $ .61 Cut to “Sell” at Commerzbank Capital
(finally cut to “SELL” after 99% loss)

Lehman:
March 12, 2001: $61.27 Reiterated “Strong Buy” at Lehman
Oct 24, 2001: $16.41 Reiterated “Strong Buy” at Lehman; “the stock is attractively priced)
(still a strong buy after 73% loss)

**Click to Enlarge Point and Figure Chart of ENE**
012305_ene_pnf_sm.jpg

The Lesson: Use both Fundamental and Technical Analysis!
And always cut your losers, no matter what anybody says, especially the broker making money from your commissions!