I wanted to take the time to update the latest New High – New Low (NH-NL) ratio chart which I follow from week to week on the MSW Index. Based on my research in 2005 and 2006, I have changed the level of bullish or positive signals to 60% from 80% with neutral now representing all readings between 0% and 60% and bearish or negative signals below 0%.
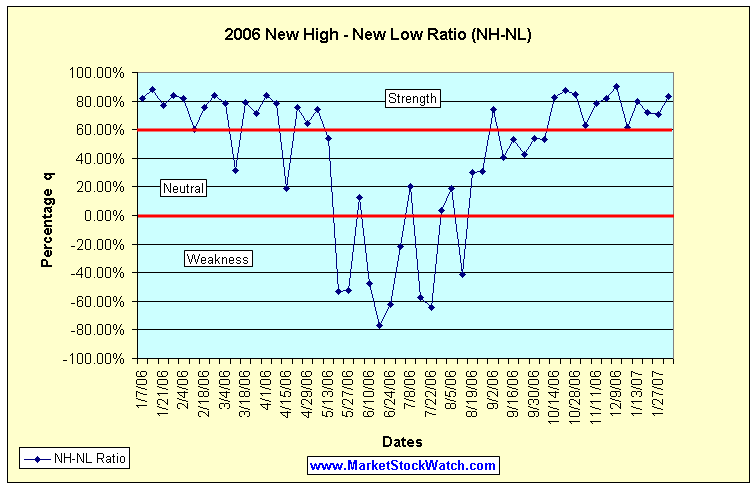
The chart in this post shows a graph that highlights the strength and weakness on the NH-NL ratio during 2006 and 2007. To calculate the percentage correctly, use this formula:
(New Highs – New Lows) / (New Highs + New Lows) * 100 = X%
For a further understanding of how I use the NH-NL ratio, read this post I made back on Tuesday, October 25th, 2005:
New High – New Low Ratio (NH-NL)
The weekly averages for the NH-NL Ratio (2007):
Saturday, January 6, 2007: 279-67, 61.27%
Saturday, January 13, 2007: 344-39, 79.63%
Saturday, January 20, 2007: 281-46, 71.87%
Saturday, January 27, 2007: 316-55, 70.35%
Saturday, February 3, 2007: 502-45, 83.55%
To View the numerical readings from 2006, visit this post:
New High – New Low Ratio


Chris, thank you for sharing this idea. Can you explain where this chart comes from? It looks like you use stockcharts.com in some of your other commentary. Is this available there, or is it proprietary?
Brian,
The chart is kept in my own research using basic excel charts. I haven’t been able to find this chart or use stockcharts to keep this information.
Nice job I may add this for my research. I will try it out.