I am revisiting a combo index chart that I highlighted numerous times last summer as the NASDAQ started a new leg up since the bull market in 2003. I described the chart as such in a post titled Can the NASDAQ – Crude Oil Index predict Bulls & Bears in June of 2006:
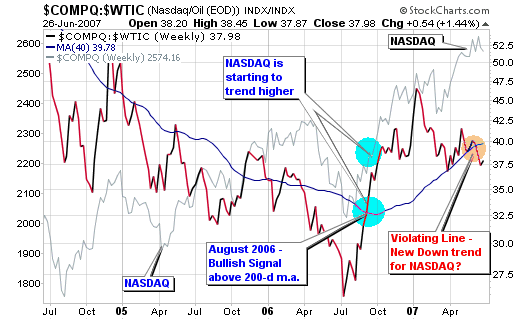
The chart is a combination index that I created using Stockcharts.com advanced tools. It combines the average close of both the NASDAQ and crude oil contracts over the past 10 years with a 200-d moving average. As you can see, the progression of this chart has called every major up-trend and downtrend before it was about to happen. The gray line on the chart represents the actual close of the NASDAQ index over the past 10 years (this line varies from the combo index).

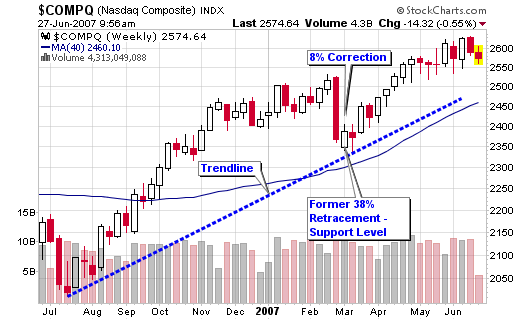
Viewing the current progression of the chart, we can see that the combo index is violating the 200-day moving average for the first time since last summer (August 2006) when the NASDAQ was trading about 20% lower than current levels. Looking back, the NASDAQ has always corrected, even slightly when the combo index crosses back below the 200-d moving average. Please see all red highlighted circle areas on the yearly chart. Our best idea of what may happen can come from the action back in late 2003 and early 2004. The NASDAQ made a multi-month consolidation before trending higher again.
The NASDAQ has gained more than 100% since the low in late 2002 and this is the first time since the bubble burst that the combo index is trading above the long term trendline (dotted black line) so things may be different this time around.
No one knows what will happen but I will remain cautious since this secondary indicator has been fairly accurate over the past ten years. Couple that with the fact that the NASDAQ is trading about 30% higher than it was last year at this time and the fact that crude oil is trending higher in a yearly cup shaped base. Many indicators scream correction but the market keeps trending higher. Price and volume will remain the primary indicator!
This post, Will the NASDAQ be 50% higher in 6-12 months? details some more information about the mysterious combo index that I follow as a secondary indicator:
…The combo index highlighted the relationship of the two indexes and actually told us on a higher level when and where the market was making rallies or starting major down trends over the past 10 years.

I asked this question on August 23, 2006:
Will the NASDAQ be 50% higher in six to twelve month from this year’s bottom?
Well, it didn’t gain 50% but it did manage to tack on 30% – NOT TO SHABBY!


Hey Chris…great post. I’m a big fan of ratio charts and use them myself in many combinations. In fact, I keep tabs on a Oil/NASDAQ Ratio as well, and observe similar things. The 8-year trendline the ratio broke above in fall 2006 was an important moment for the long-suffering NASDAQ. I explore this more in a recent post on the Tech Ratio.
Consistently great stuff here, Chris.
Thanks David! These secondary indicators can be extremely accurate over the years if they are used in sync with the primary price and volume signals.
What about the bottom trendline (not shown on your charts)? If you had shown it, it would indicate a maximum potential spread between the lower boundary and the upper boundary (black dotted line on your chart) of about a 500 point trading range.
OuttaNames,
You are correct but I didn’t see it necessary to include that line because the uppper trend line has been far more important since 2000.
Now that the bubble has burst on oil, I’m wondering what your charts look like for the last 12 months.