If you follow this blog, you were PROTECTED!
The posts below show detailed analysis and warnings over the past two months of the current correction we are experiencing. Do NOT blame anyone but yourself if your stocks are sitting there getting slaughtered over the past couple of weeks.
Eugene D. Brody was Right:
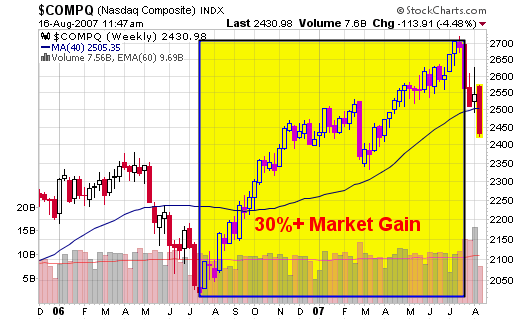
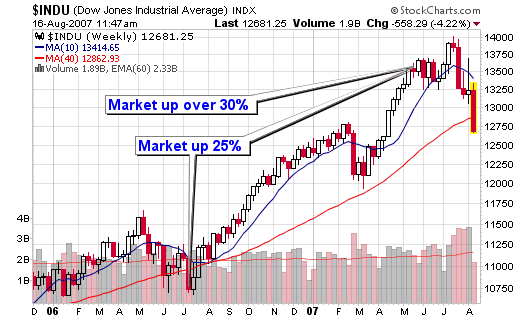
“Sell stocks whenever the market is 30% higher over a year ago”
Ice Cold Hype! August 10, 2007
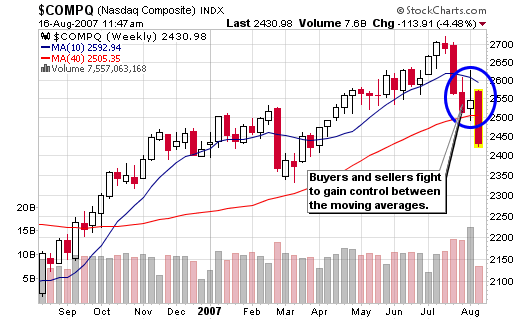
“This type of action is clearly an indicator of buyers and sellers struggling to gain the upper hand. I won’t be the one to predict which group will win but I can tell you that I currently hold two long positions and one short position heading into tomorrow. So I guess I am playing both sides of the fence. I like my short heading into morning trading.”
Don’t Believe the Hype! August 7, 2007
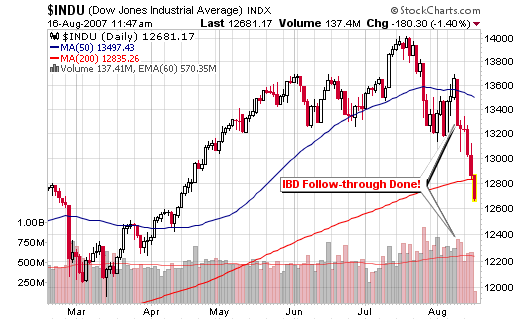
Sorry to tell you but it was all Hype by the media, including my favorite: IBD!
“IBD states that the recent market lows failed to undercut the previous low which makes the follow-through viable but I am not buying it. Financial and insurance stocks led the markets higher Monday; not the ideal groups to lead a rally.”
We took out the 200-day moving average!
“It will be interesting to see if the NASDAQ can hold the 200-day moving average and if it does, none of this research matters right now. However, a violation of the line is only a confirmation that this market wants to correct 15% or more.”
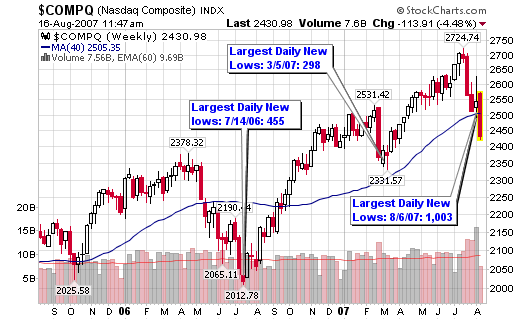
A Negative New High – New Low Ratio (NH-NL) August 2, 2007
“Could the NH-NL ratio be marking the beginning and the end of the strong run from 2006 to 2007?”
“So what does this all mean?
It means that the market should be ready to correct by 10% based on the history of my NH-NL studies.”
Taking Partial Profits July 19, 2007
I started taking profits just as the market reached a top – based on my technical indicators!
It’s the summer and volume is typically quiet and profits have been very handsome in 2007 so I started to sell shares yesterday in JASO. After doing my research last night, I have decided to take down at least half my position in four other holdings:
BIDU, EDU, LOOP and MA
NASDAQ Stocks show Moving Average Divergence July 2, 2007
“Another secondary indicator is pointing to an exhausted market that is due for a correction or pullback but please understand that this is only a secondary indicator.”
“It tells me that the weaker stocks are starting to drop below their 50-day moving average support level which indicates that the market leaders and general market may soon follow.”
Don’t be Greedy June 19, 2007
“I have talked numerous times about the market moving 30% higher than it was last year and how this is a warning of a pending correction in the near future.”
“I can’t stress enough how you must protect your profits when the general market is up 30% over its levels from last year. Set hard physical stops and don’t chase extended stocks even if they have excellent fundamental and technical characteristics.”
Click through or scroll down to see the updated charts that I used in these original posts!

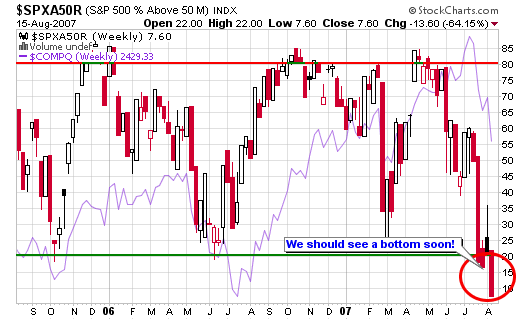
This final chart suggests a short term bounce within the next week or so.
Enjoy and be safe trading the markets!


Hey Chris,
You done good! Thank you! I’m curious, at which point on the continuum of financial success would you compromise your integrity & trust for the big kahuna?
–jes’ curious, Lucky T.
Great Post Chris,
I was out of the market for other reasons, but I follow it closely every day. Its been ugly for the bulls lately, and really choppy. Thanks for posting your thoughts on the market, they are great warnings, and at other times, green lights for the rest of us.
On a related note, Sub Prime Slime is even extending into the virtual world!:
http://www.wired.com/gaming/virtualworlds/news/2007/08/virtual_bank
About your charts. At age 54 I find your charts better than sex. Maybe at age 64 with a big, fat, wallet I’ll rediscover sex. Until then–you da’ man!
Anyone who didn’t take anything off the table before this drop was being plain greedy. There is a point soon though where the market trend should resume upward.
Aaron,
I agree based on the last chart posted in this series.
Lucky T,
Not sure I follow your question in your first comment.
Ty,
I made a small profit on UA puts but I bought way too soon at $1.75 cost basis. They dropped to $.35 and I bought shortly after. Sold everything today (on the morning drop) for a profit but I could have done much better. Still learning the options game.
Chris,
This was an awesome post man, way to lay it out there and call it! 😛
Thanks Blain! Now share your secrets to a high Alexa ranking: it must be the forums!