Don’t base your portfolio buys on P-E Ratio alone; you will most likely miss the biggest winners of each cycle!
I use the Price Earnings (P-E or P/E) Ratio as a secondary indicator for buying and selling stocks but I don’t use the ratio in the same a manner as many value investors teach. I will explain the difference in my methodology for using the P/E ratio to your advantage.
Many value investors will pass on a growth stock that has a P-E ratio higher than a predetermined level. For example, they may discard all stocks that have a ratio of 20 or higher, regardless of the industry group they come from. Some investors will discard any stocks that have P-E ratios above the industry group averages, concluding that they are grossly overvalued. I am not saying that this method doesn’t work, because it does but it will not work when you focus on buying young innovative small cap stocks that are growing at tremendous rates, rates that “big caps” can no longer sustain. Growth stocks cost more because they GROW!
I have never passed on buying a stock due to its P-E ratio being too high. What is too high? Too high to one investor may be low to another investor. This is the same logic that I use when speaking of stock’s price. One problem that I have with some value investors is their lack of understanding of the movement of the P-E ratio line on a chart. As a stock begins to move 100% or 200% from its pivot point, the P-E ratio will also move higher over the course of time. Plotting the P-E ratio on a chart will show you how much of a gain the ratio has made as the stock continues its up-trend.
Value investors that pass on buying stocks with P-E ratios above a certain threshold have missed some of the biggest winners of all time (the 10-baggers as Peter Lynch would say). Analysts frequently downgrade stocks when their P-E ratios cross what they believe to be fully valued thresholds. I show three examples at the bottom of this post along with their charts pasted throughout (GOOG, AAPL, BIDU).
The P-E ratio uses a stock’s current price and divides it by total earnings per share over the past four quarters. For example, currently GOOG has a P/E ratio 46.73 with a share price of $609.62. Its last four quarters of EPS add up to $13.04. Its P-E ratio is $609.62 divided by $13.04, or 46.73.
Growth stocks usually sport higher P-E ratios than the rest of the general market, even at the start of up-trends. With profitable growth stocks, a high P-E ratio typically means that the stock is enjoying strong demand. If a stock climbs in price from 40 to 60, its P-E ratio also gains 50%. Even though the P-E ratio may be high according to some analysts and value investors, the stock may be about to breakout from a pattern and go on to double, triple or even better. Would you want to miss out on a possible 100% gain because the P-E ratio is too high? I have had more success using the PEG Ratio instead of P/E Ratio.
Google could be trading above $900 per share based on its average earnings estimate for FY08. The current P-E ratio is most likely too high for most value investors but I can’t ignore the growth prospects based on one simple academic calculation. Remember, the market will pay a premium for luxury items. Items they feel are worth the extended value!
Investor’s Business Daily conducted an excellent case study in 1996-97:
“The 95 best small- and mid-cap stocks of 1996-97 had an average P-E of 39 at their pivot and 87 at the peak of their run-ups. The 25 best large caps of those years began with an average P-E of 20 and rose to 37. To get a piece of these big winners, you had to pay a premium.”
When I purchase a stock, I note the current P-E ratio and chart it along with the price. Historically, P-E’s that move up 100%-200% or more while the stock is advancing, usually become vulnerable stocks and can start to become extended and flash sell signals. It holds true for a stock with a P-E starting at 15 and going to 40 or a stock with a P-E of 50 and going to 115. Don’t skip over EXCELLENT companies that are growing at amazing clips because of a high P-E ratio.
What may seem high now, may be low later on!
Earnings and Sales are much more important than a simple P-E ratio. Price and volume are the most important when looking at the charts. The P-E ratio is just a secondary indicator that can be used to further analyze the stocks in your portfolio but never base a buy or sell decision on this number alone.
Always use price and volume as your first line of offense and defense. From this point, turn to some dependable secondary indicators to confirm your original analysis and then make a decision. I would never throw out a stock because its P-E ratio is too high.
Growth stocks are expensive for a reason; they are profitable luxury items!
Take a look at three stocks below and their P-E Ratios over the past couple of years. Value investors that look for P-E Ratios below 20 would have missed these and dozens of other super stars:
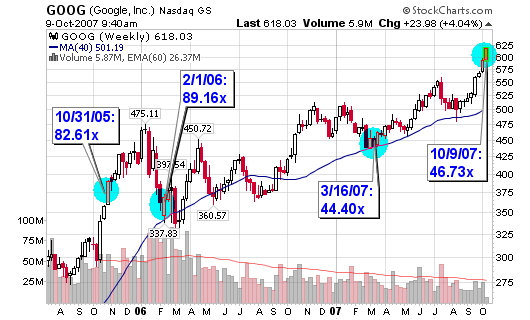
GOOG: 50.99x on October 9, 2007; Share Price at $619.82
GOOG: 44.40x on March 16, 2007; Share Price at $440.85
GOOG: 89.16x on February 1, 2006; Share Price at $432.66
GOOG: 82.61x on October 31, 2005; Share Price at $372.14
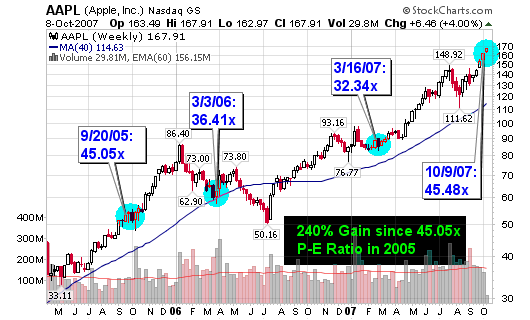
AAPL: 45.48x on October 9, 2007; Share Price at $170.03
AAPL: 32.34x on March 16, 2007; Share Price at $89.59
AAPL: 36.41x on March 3, 2006; Share Price at $67.72
AAPL: 45.05x on September 20, 2005; Share Price at $53.19
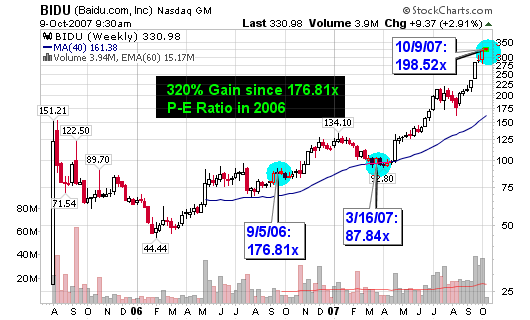
BIDU: 198.52x on October 9, 2007; Share Price at $327.26
BIDU: 87.84x on March 16, 2007; Share Price at $95.75
BIDU: 176.81x on September 5, 2006; Share Price at $77.80


Could you tell me the best place to find historical stock charts? Morgan
Morgan,
I use stock charts and my brokerage accounts for info. I obtained the P/E ratio information from my own (past) research in my trade journals and my archived IBD newspapers.
I think this is where a PEG ratio can be far more helpful than the normal p/e ratio. I like to use the PEG ratio because it allows me to check the valuation of the company while still accounting for its growth rate.