The charts clearly called the top of this market in October 2007 and did so with great accuracy. The NASDAQ was flashing multiple distribution days as you can see from the blog posts I made three months ago. You can view the original color charts through the links provided but I am including them here as grayscale images. I wrote about a possible top on several occasions in October but the market leaders continued to move higher so we kept trading the trend.
Bottom line – the warning signs were there, we talked about selling the red flags and it all came to fruition.
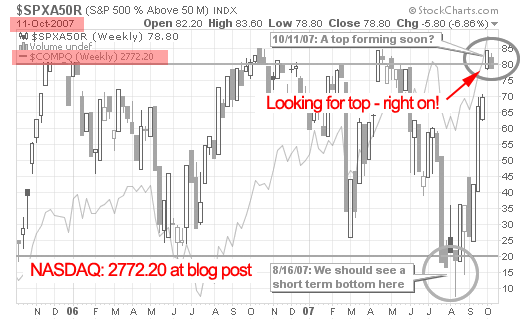
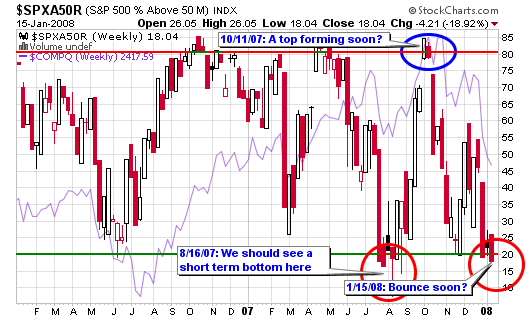
The chart tracking the number of stocks on the S&P 500 that are trading above their 50-day moving average has been extremely accurate. It is now starting to call for an intermediate bounce to the upside as the index flirts with the oversold 20 area (see color charts below).
Distribution Day #1: October 12, 2007
The number of stocks above their 50-day moving averages crossed above the overbought level of 80 last week and we saw our first major sell-off distribution day yesterday. This doesn’t mean you must rush today to sell all of your holdings but do understand that the next sell-off is not far from happening. Study the chart below and follow the purple line to see where and when the market had peaks and valleys as related to the number of stocks on the S&P 500 above or below their respective 50-day moving averages.
This is only a secondary indicator but one of the most reliable while trying to look for clues to a short term market top and/or bottom. I have come to realize that the bottom signals have been more accurate than the topping signals over the past several years!
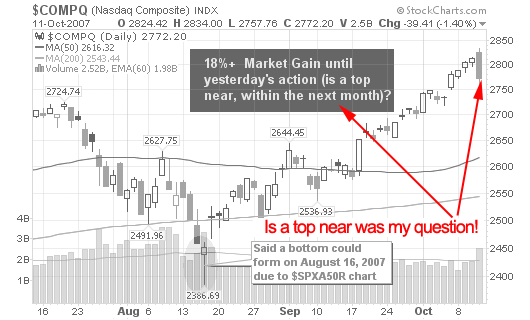
The markets flashed a heavy distribution day Thursday as the NASDAQ was down 1.4% on volume 60% larger than the previous day. This was the largest showing of volume in two months and is not healthy because it was pure distribution. It was only the second distribution day over the past month so we can’t call this a bear run but please be on the lookout for a possible correction of 5%-10%. Technology stocks led the decline as BIDU gave back 10% of its amazing run.
Second Major Distribution Day, October 20, 2007
We witnessed our second major distribution day as the DOW was down 2.6% on volume 40% larger than the prior trading day. The NASDAQ was down 2.6% on volume 15% larger than Thursday.
It was the worst selloff for the NASDAQ since February and the largest for the DOW since August. Volume surged across all major indexes but do keep in mind that it was options expiration day.
Technically speaking, we now have 4 distribution days for the NASDAQ and 3 for the DOW over the past month. It’s now time to start focusing big-time on the market leaders to see where they are going to take this market. If they start to roll over, you better be quick to take profits and even quicker to take losses.
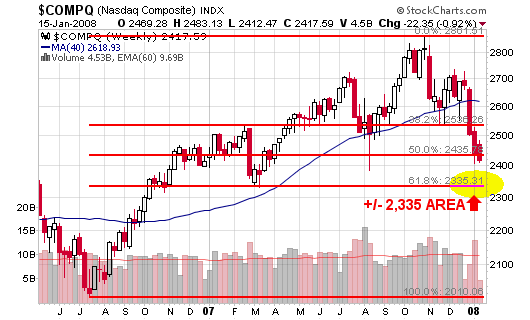
What are the charts saying today?
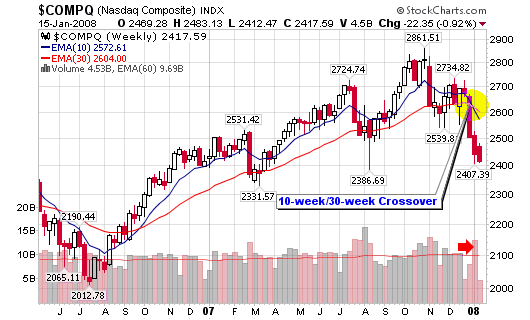
With the NASDAQ down more than 10% since those October posts, they are saying an intermediate bounce to the upside is due with additional downside pressure thereafter. I am on the sidelines (95%) waiting to make a move when the time is right.


Chris, YGE briefly hit $25 today. Did you take the trade or are you planning to buy later? I just couldn’t pull the trigger…
I see way too many cherry picking.
A question and a statement are different things.
I know you have some bad picks, why not highlight what went wrong with them?
Cherry,
I most certainly have some bad picks and do highlight them as well over the course of a year. With a slightly higher than 50% average in 2007, almost half the picks were wrong.
So, what’s your point?
It’s the net result that is most important. 50% of my picks were wrong but the selections as a whole were up more than 43% (buy and hold – even better using sell rules).
That’s the only bottom line that I am concerned with. I could care less if 80% of my picks were wrong if I still showed a profit. That’s what you need to learn. It’s the net result, not how many are right and wrong.
Also,
The individual “stock of the day” buys stopped after October. I wonder why!
The market was overbought so I stopped buying as heavily as I did earlier in the year.
Of the 32 portfolio stock of the day stocks, only two were bought in Ocotber, one on the 2nd and one ont he 30th.
Nothing was posted in November or December for new buys, only accumulation to stocks I already owned. I listen to the charts! How’s that for cherry picking? I don’t hide anything here (I don’t need to because I trade for myself and write for free so what’s the motive), it’s all in writing for 50,000 viewers per month.
pn, I gave an answer to YGE on that blog post. Haven’t pulled the trigger yet but maybe a portion tomorrow based on market open.
“That’s the only bottom line that I am concerned with. I could care less if 80% of my picks were wrong if I still showed a profit. That’s what you need to learn. It’s the net result, not how many are right and wrong.”
That is precisely why most traders lose. They only look to accuracy rate, and not to the risk / reward ratios. There are plenty of traders that are wrong 50% of the time, or more, but because they have their risk / reward ratios set properly – THEY MAKE MONEY!!!
http://www.youtube.com/watch?v=nmBlP4l7TNo&feature=related
Airelon,
Please read the blog before this type of a response. Every trade I make must have a reasonable risk/ reward ratio prior to entering.
Your net result comes from proper risk/ reward. Some systems have 20% positive rates, some have 50% and some have 80%. The point: the one with 20% can be more profitbale than the one with 80%.
I usually come in near 50% ( /-) a few percent.