Fall Stocks to Watch 2019

This list predominately focuses on younger stocks that have IPO’d within the past year or two. In addition to focusing on younger stocks, I focused on companies that are growing sales by at least double digits, preferably 25%+ QoQ.

I did not include any of the stocks listed from my annual “Stocks to Watch in 2019” nor did I list more established stocks that have been trading on the market for years (including holdings already in my account).

I wanted to develop a fresh list of potential opportunities that I could add to the portfolio (as of 7/29/19, I do not own any of the stocks listed below, with the exception of UBER).

With that said, traders and investors must be prudent when establishing positions by paying careful attention to the overall market health (is the market extended), the stock performance itself (is the individual stock extended) and the valuation of the stock (several listed have high valuations which do concern me short term).

  • ZM – $96.47: Zoom Video Communications, Inc.

    The stock, which provides remote conferencing services using cloud computing, IPO’d in April and quickly traded from $60 to above $100 within 6 weeks. I’m not comfortable with the pricey valuation of the stock but I use and believe in the product. It’s everywhere I conduct business: clients, consultants, vendors, manufacturers, etc.

    The 50-day moving average (50d ma) formed as of July and the stock is trading above it over the course of the month. Valuation aside, an ideal accumulation area is near this moving average ($90.91 as of 7/29/19).

    Sales have increased from $30.9MM in July 2017 to $122.0MM in April 2019, an average change of 145% over the past 8 quarters.

    Earnings have been positive the past 4 quarters but only by a few cents.

    The stock is worth a position with a tight leash due to that high valuation.

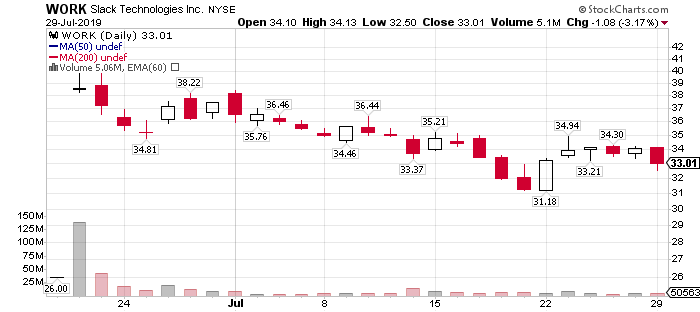
  • WORK – $33.01: Slack Technologies Inc.

    The stock, offering a cloud-based set of proprietary team collaboration software tools and online services, debuted in June and has struggled as the price is down about 20% from the peak on its first day of trading.

    Sales have increased from $51.3MM in July 2017 to $134.8MM in April 2019 for an average quarterly gain of 96% (this figured has dropped from 160% in Jan 2018 to 67% in the latest reporting period). Note that earnings are still negative at -0.07 in the latest quarter.

    Considering the stock is still so young, it’s difficult to identify an ideal entry area without knowing how far it can fall before establishing a base. With that said, I like the technology so one could grab shares here and hold longer term.

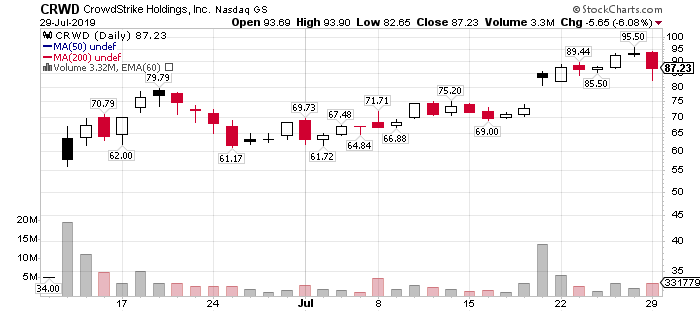
  • CRWD – $87.23: CrowdStrike Holdings, Inc.

    Another young stock, debuting in June 2019, coming from a hot cyber security sector (provides endpoint security, threat intelligence, and cyberattack response services), competing against companies such as PANW, CYBR and OKTA. Okta has been one of the best performers from the first half of 2019 in my Stocks to Watch (+120.27% as of 7/27/19).

    Sales have increased from $26.7MM in July 2017 to $96.1MM in April 2019 for an average quarterly gain of 118%. Earnings are still negative and are estimated to stay that way for at least the next two years.

    Similar to several others on this list, the stock is too new to establish an ideal technical entry point so if you believe in cyber security, you can start to accumulate shares on any pullback on lighter volume. Keep an eye on the gap-up that took place July 18th to July 19th when the stock gained 14% from $72 to $83. Gaps don’t always close prior to major runs but I prefer them to.

  • SE – $36.73: Sea Ltd.

    A young Singapore based company that specializes in wireless and wired digital entertainment and e-commerce platforms.

    Sales have increased from $101.6MM in June 2017 to $351.9MM in March 2019 for an average quarterly gain of 72%. Note that sales have accelerated during the past four quarters for an average gain of 113%. Earnings are still negative and are estimated to stay that way for at least the next two years. The number of institutions owning the stock has nearly doubled in a year but remains relatively low compared to high growth stocks (plenty of room for accumulation).

    The stock has more than tripled since the December lows and is well above the 50d and 200d ma’s so I suggest accumulation to wait for a healthy pullback, meaning a drop on lighter volume. The 50d ma would be the first area of accumulation as the 200d is $16 lower than the trading price. Maintain tight stops if you accumulate as the stock rises, well above the moving averages.

  • ESTC – $100.38: Elastic NV

    I posted the following tweets regarding ESTC in April and May (a search company that builds self-managed and SaaS offerings for search, logging, security, and analytics use cases):

    4/24/19: “$ESTC $85.95 has been making my screens for the past week or so. On watch as it looks ready to move back towards $100 building right side of base. Sales growing an ave of 78% QoQ past 7 qtrs.”

    5/09/19: “$ESTC $85.43, building a quiet 10 week base before possible move back towards $100 and beyond. One could grab shares here just above 50d ma.”

    Well, the stock broke out of the flat base and is now trading above $100. The stock hit a low of $72 on June 26th and has since gain $30 over the past four weeks on healthy volume. It’s a bit extended now so watch for any pullback on lighter volume, back to the 20d or 50d moving averages. We can also watch to see if the triple digit threshold can act as support for a possible entry area.

    Sales have increased from $31.6MM in July 2017 to $80.6MM in April 2019 for an average quarterly gain of 76%. Earnings are still negative and are estimated to stay that way for at least the next two years.

  • DOCU – $53.90: Docusign, Inc

    The company provides e-signatures that allows businesses to digitally prepare, execute and act on agreements. Being in the real estate industry (design and construction), we are constantly drafting, reviewing and executing contracts and I can tell you that the majority of folks are using this solution.

    Sales have increased from $125.5MM in July 2017 to $214.0MM in April 2019 for an average quarterly gain of 36%. Earnings turned positive in the January 2018 quarter and have maintained this territory since, with a $0.07 EPS in April 2019. Estimated annual EPS is projected to go from $-0.18 in 2018 to $0.38 in 2021.

    The stock has been forming a base the past five months since peaking at $59.62 in March 2019. An investor can accumulate now if they believe in the business. Ideal entry points are near the 50d and 200d moving averages.

  • ZS – $85.57: Zscaler, Inc.

    Zscaler operates in the global cloud security sector so it also competes against PANW CYBR OKTA and CRWD. I have liked this sector for several years now and don’t believe it’s going away anytime soon.

    Sales have increased from $36.5MM in July 2017 to $79.1MM in April 2019 for an average quarterly gain of 56%. Earnings crossed from negative in July 2018 to positive in October 2018 and have remained there since. Estimated annual EPS is projected to go from $-0.20 in 2018 to $0.19 in 2020. The number of institutions owning the stock has doubled over the past 18 months.

    I started to tweet about Zscaler in February 2019, as it was making screens on a consistent basis. I profiled the chart in March saying:

    “$ZS + 71% YTD. Exploded in March but the gap-up always concerns me. Ideally, I’d like to see that close, which could provide entry near 200d”

    Well, the gap didn’t close, which I noted doesn’t always happen when a stock wants to run. I didn’t by ZS and it has since gone from $67 to as high as $89. The stock is up 110% year to date and is currently extended from an ideal entry point but keep an eye on it for any healthy pullback to a support area of major moving average. The 50d ma has been a nice accumulation area over the past several months, providing 4 opportunities to enter.

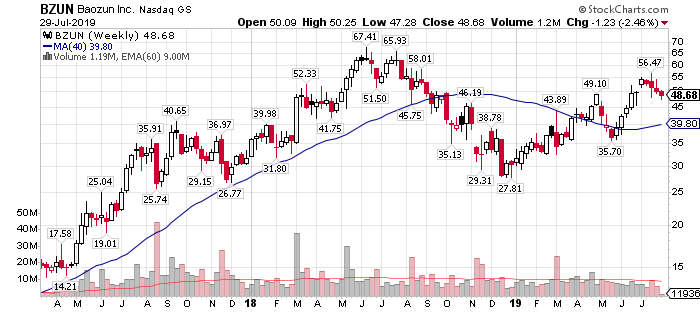
  • BZUN – $48.68: Baozun Inc.

    The stock, which is a famous brand E-commerce business partner, and a leading digital technology and solution company in China, has been building a cup shaped base over the past 12 months after reaching a high of $67.41 in June 2018. It corrected to a low of $27.81 in the market lows of December 2018, followed by the right side of the base in 2019.

    Sales have been increasing an average of 27% QoQ over the past two years while earnings are positive, between $0.09 and $0.50.

    The ideal accumulation area is closer to the 50d and 200d moving averages. The month of May provided investors with an ideal opportunity in the 30’s (at the 200d ma) so let’s keep an eye on another possible setup. The stock appears to be pulling back nicely over the past four weeks.

  • GBTC – $12.16: Grayscale Bitcoin Trust

    The GBTC shares track the Bitcoin market price (based on Bitcoin per Share), less fees and expenses. Each share represents ownership of approximately 0.092 bitcoin, an amount that will decrease over time as management fees are charged to the fund. It’s not a 1-to-1 correlation to the actual price of Bitcoin so that’s why I recommend investors to buy Bitcoin direct rather than have profits eroded with this vehicle.

    With that said, it’s an alternative to trade Bitcoin if you don’t want to buy the crypto currency direct and trade it easily in your stock account. Gemini or Coinbase are the exchanges to buy direct (I currently own Bitcoin through each exchange but have been growing greater confidence in Gemini).

    GBTC has traded back down to its 50d ma (just below) over the past several days which could be a short term buy area. I wouldn’t be surprised if Bitcoin and GBTC corrected back (closer) to their respective 200d ma’s, which currently sits at $7.25. The $9 area is not out of the question and would be an ideal level to accumulate for a trade ($8,000’s for the actual crypto currency).

    This is a speculative Bitcoin play without buying the actual crypto currency.

  • DOYU – $10.50: DouYu International Holdings, Ltd.

    The stock, a Chinese video-game live-streaming platform, debuted two weeks ago and is a direct competitor of HUYA, a stock I currently own.

    Sales have increased from $54.7MM in June 2017 to $221.6MM in March 2019 for an average quarterly gain of 135% (amazing, if accurate). Earnings went positive for the first time in the March 2019 reporting period, at $0.02.

    Similar to WORK, the stock is too new to establish a technical entry point so if you believe in live streaming games & entertainment and the size of the Chinese market, grab shares here and hold for the longer term.

Other interesting young stocks to watch as well:

  • PINS
  • PAYS
  • UBER
  • LYFT
  • YETI

Previous Stock Trends Lists:

January 1, 2019: Stock to Watch in 2019

January 1, 2018: Stock Trends for 2018

January 2, 2017: Stock Trends for 2017

January 18, 2015: Stock Trends for 2015

My Wife’s Mutual Fund:

Original Post:
August 6, 2014: My Wife’s Personal Mutual Fund Outperforms the Pros

Follow-ups:
February 21, 2016: My Wife’s Personal Mutual Fund Crushes the Markets, AGAIN

August 7, 2016: My Wife’s Buy & Hold Strategy Still Crushing the Professionals

November 19, 2017: The Wife’s Stocks Outperforming 3 Years Later

November 11, 2018: My Wife Picks Stocks better than You

Stock Trends for 2017

The trends that I am watching in 2017 are not much different than what I have been following and investing in over the past two years. As Newton’s first law stated,

“An object in motion continues in motion…”.

I could search for the “next hot thing”each year but why make investing more difficult than it already is when certain trends, technologies, products, services and companies continuously work.

Perhaps this list is old and boring (Buffett likes boring) but we’re here to make money, not be sexy.

Investing in the stock market should not be exciting or a path to get rich quick, rather it’s meant to moderately grow our existing capital over longer periods of time.

As I grow older, I have learned that I can beat most investors by being average. By investing (longer term) in low cost index funds and an assortment of stocks that have proven their worth, my returns have consistently outperformed social media stock pickers, active managers and mutual funds.

In fact, I suggest that 99% of all investors stick with low cost index funds and skip individual stocks altogether.

Ask yourself: why would you risk your capital with an active manager who will likely underperform over time, once the fees and activity eat away at the gains?

The S&P has provided an annualized gain of 14.5% over the past 8 years while the Nasdaq 100 has provided a 20.4% annualized gain. That’s a cumulative gain of 195% and 339% respectively.

I haven’t seen many active managers do better than this over the same period. Once again, why risk the guess work of tops, bottoms, trends, fees, commissions, etc.? If active managers were performing 2x-3x+ the averages, over 10+ year periods, then I would consider their services.

Now, let’s get to the list (which contains much of the products and services I use, as well as several of the stocks I already own):

*NOTE: the overall health of the markets must be positive for many these investments to do well.

Digital Currency:
As I did in 2015 (Stock Trends for 2015), I will skip the details surrounding blockchain and Bitcoin (which is above $1,000 as this post). Cash is still king worldwide, as more than 80% of all transactions globally (and 40% in the United States) are still carried out using cash, particularly transactions involving small amounts of money. So why is this good? Because the growth opportunity of electronic transactions is still substantial. I own several on the list and would recommend any of the seven.

  • PYPL: $39.47. PayPal operates as a technology platform company that enables digital and mobile payments on behalf of consumers and merchants worldwide. The stock appears to be building a solid base above the up-trending 200d ma. A few more solid earnings reports and I can see the stock making a 50% move in 2017, from $40 to $60, riding that 200d ma higher.
  • AMZN: $749.87. Amazon Payments service competes with PayPal, Apple Pay, and Google Wallet, already owns a sizeable market share and may be its most “underappreciated” business, per RBC Capital. The stock is consolidating near it’s 200d ma and if it holds, could be poised for the next leg higher ($750 to $1,000?).
  • V: 78.02. Visa operates the world’s largest retail electronic payments network and is one of the most recognized global financial services brands. The stock has been mostly sideways over the past 6-12 months and is currently below the 200d ma during a multi-year up-trend. As a long-term shareholder, I’m holding, until it proves otherwise.
  • MA: 103.25. MasterCard operates the world’s second largest retail electronic payments network. Like Visa, I will continue to ride and recommend this stock until it proves otherwise.
  • AAPL: 115.82. Apple trailed its peers and the broader market in 2016 but may launch a comeback in 2017. The stock can be listed in several “trends” but I’ll place it here due to Apple Pay. The stock is back above its 50d and 200d ma’s. It needs a catalyst to make a run, perhaps the iPhone 8, a new technology and/or its electronic pay network? Deep down, I question whether the magic is gone, now that Jobs is long gone. We’ll see, but for now, I am still bullish on the company and stock. Adding shares below $100 has proved profitable over the past two years.
  • GOOGL: 792.45. Alphabet has both Google Wallet and Android Pay (I am an Android guy, without a doubt). The stock is consolidating above the 200d ma and could be setting up for a run towards $1,000. With wallet, pay, advertising, self-driving cars, etc., the stock could be listed under most trends on this post.
  • VNTV: 59.62. Vantiv is an electronic payment processing services to merchants and financial institutions in the United States. I placed the lesser known company/stock on my “13 Stocks for 2013 – 2nd Half” portfolio. I was early, as the stock traded mostly flat for the next 12 months but then it took off and more than doubled since. Like V and MA, it’s in a profitable business with excellent earnings. I can see this stock trading at $100 per share in the future.

Autonomous Driving:
Tesla, Ford, Uber, etc., each of these companies keep touting the revolution of self-driving cars. It’s coming and the technologies keep expanding. Nvidia was highlighted in 2015 and became the leader by going on a 440% tear, from $19.96 to a high of $119 in December 2016. The chips are hot again, therefore I added Intel to this list (another blast from the past).

  • NVDA: 106.74. NVIDIA Corporation, operates as a visual computing company worldwide. The stock is up big over the past 6-12 months and may need some time to digest the gains. I would advise new investors to allow the stock to consolidate on lower volume above a support area, such as the 50d ma.
  • MBLY: 38.12. Mobileye develops computer vision and machine learning, data analysis, and localization and mapping for advanced driver assistance systems and autonomous driving technologies. The stock is down since making my 2015 Trends list and has had a volatile ride with a high above $64 and a low of $23.57. Look for the stock to stabilize and mature a bit in 2017, now that the IPO is in the rear-view mirror. I could see a move from the upper $30’s to above $50 in 2017, however, it must recapture its major moving averages first.
  • INTC: 36.27. Intel designs, manufactures, and sells integrated digital technology platforms worldwide. Like NVDA, Intel is now in the self-driving game with its chips. The stock gained more than 20% from its low point of 2016 and is currently in an up-trend above the rising 200d ma. Chip stocks appear to be all the rage again (is this good or bad, as memories of the dot-com bubble appear in my head).
  • TSLA: 213.69. Tesla Motors Inc. designs, develops, manufactures, and sells electric vehicles and stationary energy storage products. What can I say, I’m a big fan of Elon Musk. I added the stock due to the Musk factor but I am suspect. It’s struggling to recapture and sustain a move above its 200d ma. December was a big month for the stock but since 2015, it has been mostly flat with lots of volatility (similar to MBLY).

[Read more…]

Stock Screens & Scans for Traders & Investors

As a part time trader & investor, I strictly use end of day data for my screens and scans as I don’t have the luxury of watching the tape all day long (nor do I want to). With that said, I do receive text alerts if a buy signal is made or if a sell signal has been violated. Using my smart phone or tablet, I can and do trade during business hours (when absolutely necessary) but it’s not imperative.

I encourage investors and traders in all time frames to evaluate stocks for investment using both fundamental and technical analysis. A day trader and even a swing trader can get away with avoiding fundamental analysis but I highly recommend both methods of analysis for intermediate and longer term trend traders and investors. Both tools are equally important in making serious decisions with your hard earned CASH!

Let’s start with a list of the key fundamentals that I require to be filtered within my mechanical screeners (please note that you should use your screener of choice):

Simple Fundamental Screener Criteria:
The criteria listed in this section can be used together or arranged in a variety of ways to generate multiple screens containing all possible opportunities. Get a feel for specific screens and determine which are the most successful during certain market conditions.

Most Important Fundamentals:

  • Increasing Earnings (current, past: quarterly, yearly and future estimates)
  • Increasing Sales (current, past: quarterly, yearly and future estimates)
  • Increasing Net Income (current, past: quarterly, yearly)
  • Increasing Institutional Sponsorship
  • Increasing and strong Relative Strength ratings vs. general market

Most Important Price Data:

  • Stocks making New Highs
  • Stocks within 15% of New Highs
  • Stocks trading slightly above or within 5% of the 50-d ma
  • Stocks within 10% of the 200-day moving average (in weaker markets)

Less Important Metrics:

  • Increasing Return on Equity (ROE)
  • Price / Earnings Growth (PEG) – less than 1 is preferable
  • Accumulation/Distribution ratio (up days vs. down days)
  • Up / Down Volume over past several months

Fundamental screeners will scan thousands of stocks narrowing down the universe to a couple dozen to a few hundred each night or weekend. The more bullish the market, the larger the list of stocks will be and vice versa for weak markets. From here, the savvy investor turns to technical analysis to identify “when” and “where” to place a new position for the ideal risk-to-reward ratio.

General Market Metrics & Technical Analysis:

  • Determine if overall market is in a specific trend (up, down or sideways). Use multiple moving averages to quickly determine the trend.
  • Evaluate sister stocks or stocks within the same industry group (strength travels in groups so the probability of success rises when buying into a strong industry).
  • Study the one year weekly chart (preferably candlesticks)
  • Study the six month daily chart (preferably candlesticks)
  • Look for increasing accumulation days (stock up on above average volume)
  • Evaluate the Point & Figure chart for clean support and resistance levels
  • Look for basic chart patterns such as flat bases, cup bases, saucer bases, triangle breakouts, obvious trends along a moving average, etc…
  • Properly forming bases
  • Pivot points
  • Breakout areas
  • Extended stocks
  • Stocks pulling back to key support lines
  • Favorable risk-to-reward setups
  • Check volume action when bases are formed

Market Breadth – Using Screens
It is extremely important to pay attention to the quantity of stocks making your screeners from time to time. The length of the list alone will tell you how healthy or how weak the market currently is, without even checking another factor.

For example, a standard screen of mine searching quality stocks making new highs should be full of candidates during a fresh up-trending market. The list should be full of candidates as long as the trend continues. As soon as this list starts to thin out on a daily and weekly basis, become cautious that the breadth is weakening.

Example of my most successful screens:
When scanning these screens, I will view the stocks in descending order starting with the day’s largest price percentage change and occasionally starting with the day’s largest volume change versus 50-day average.

1. Quality Stocks that are trading within 15% of 52-week Highs

  • Current price is within 15% of the 52-Week High
  • Earnings increasing qtr-over-qtr and year-over-year
  • Relative Price Strength greater than 80% of the general market
  • Current 50-Day Average Volume is at least 100k shares per day
  • % Increase in Volume (Current Day) vs. 50-Day Average Volume: Volume 50% larger than the 50-d average

2. Quality Stocks making New 52-week Highs:

  • Current price is trading at a new 52-Week High
  • Earnings increasing qtr-over-qtr and year-over-year
  • Relative Price Strength greater than 80% of the general market
  • Current 50-Day Average Volume is at least 100k shares per day
  • % Increase in Volume (Current Day) vs. 50-Day Average Volume: Volume 15% larger than the 50-d average

3. Institutional Sponsorship Increasing

  • % of the number of Institutions for Current Quarter vs. Prior Quarter have increased by 10%
  • % of the number of shares owned by Institutions for Current Quarter vs. Prior Quarter have increased by 5%
  • Earnings increasing qtr-over-qtr and year-over-year
  • Relative Price Strength greater than 50% of the general market
  • Current 50-Day Average Volume is at least 100k shares per day

4. Quality Stocks with a new IPO’s within the past two Years

  • Current price is greater than or equal to $10 per share
  • Earnings increasing qtr-over-qtr and year-over-year
  • Relative Price Strength greater than 80% of the general market
  • Market Capitalization is greater than or equal to $100M
  • Current 50-Day Average Volume is at least 50k shares per day
  • % Increase in Volume (Current Day) vs. 50-Day Average Volume: Volume 50% larger than the 50-d average
  • IPO Date within past 5 years (sometimes use 3 years)

Although I run these screens at least once per week, one or two will come into favor while others fall out of favor depending on the market environment or situation. Over time, the strength and weakness of certain screens will also give you a hint as to what the overall market is doing (another breadth signal).

For example, a screen that locates quality stocks making new 52-weeks highs is best used when a market is forming a new up-trend and the overall movement is still fairly fresh. This screen is less important near the end of a strong up-trend because at this point, many of the stocks making new highs are exhausted. The trader will see more failed breakout attempts, reversals and late stage bases so the odds are no longer in favor of this screen.

In strong up-trending markets, one cannot expect to buy every stock that makes the screens so it comes down to developing a risk-to-reward calculation to grab shares in the equities that show the greatest upside.

Lastly, it’s important to understand that no investor is perfect and losses are part of the game when it comes to investing and trading. Most traders will have as many winners as they do losers (using successful screeners) so having sell rules is critical for sustainable success. Learn to cut losses short while letting winners run, no questions asked.

By cutting losses, you account will not blow-up and you will be around to trade another day, especially when your screens are screaming buy!

Stocks near 200-d MA Support

The following spreadsheet consists of 175 stocks that are trending back towards their 200 day moving average while maintaining strong relative strength. It’s essentially a screen of the stocks that have potential to catch support at the 200-day moving average and lead the market IF (a BIG “IF”) it decides to resume the up-trend.

I’ll narrow down this list of 175 to 10 – 20 of the best, technically, in my opinion (later this week).

Take a look:

Stocks to Watch: April 3, 2011

This post contains weekly charts of several interesting stocks that I am following personally and on twitter (disclosure: I own shares in more than one). Each of the following stocks have been trending higher on above average volume.

$LOGM – 46.08
$MOBI – 12.85
$NXPI – 30.59
$SODA – 46.80
$SVN – 21.83
$MMYT – 30.99

Let’s see if the $DJIA and $COMPQ will cooperate by maintaining the up-trend. Both are showing some signs of exhausting but we’ll trade what the charts are doing, not what we think they may or should be doing.