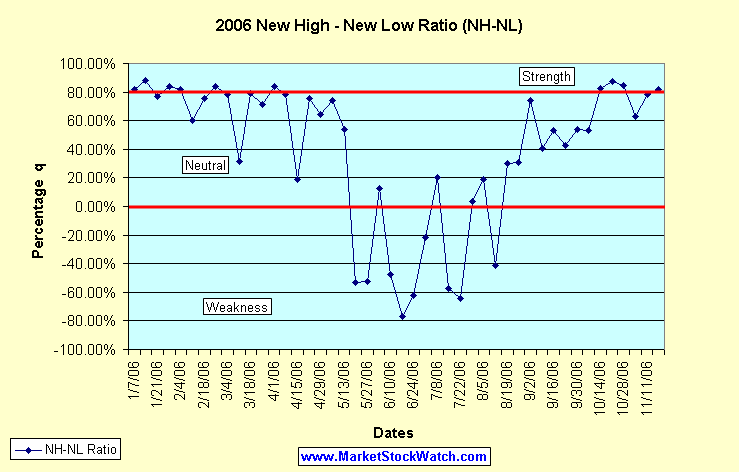
Here’s the latest NH-NL ratio chart with weekly numbers updated to the week prior to the Thanksgiving holiday. I excluded the short week so it wouldn’t skew the chart. Although the week ending on Saturday, November 18, 2006 had the highest average number of new highs (541) for the year, the strength calculation ranked it tenth in 2006 behind many of the readings from January and October. New highs were greater during the week of 11/13-11/17 but the strength was less than three of the weeks in October which saw the number of new lows 30%-50% lower. Both sets of numbers play an equal role in the calculation of this NH-NL strength ratio.
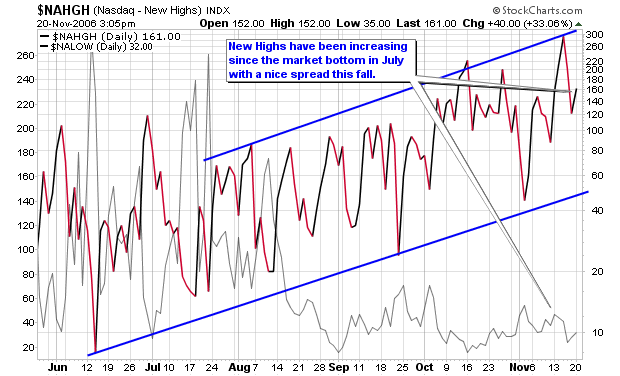
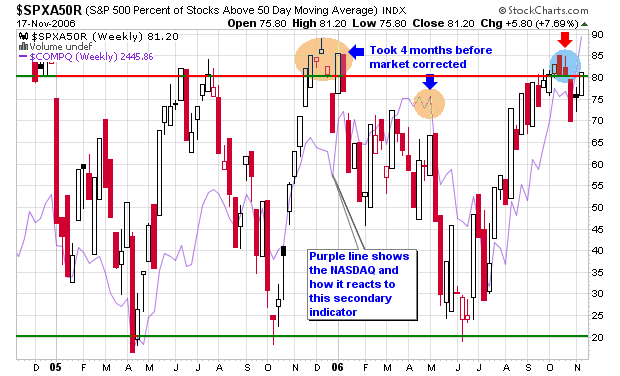
Yesterday saw a reading of 525-35 which equals an 87% rating but the readings were weaker earlier in the week so the total won�t make the top 10 (as long as today is quiet). In addition to the NH-NL chart, I wanted to post the chart of the number of stocks on the S&P 500 that are trading above their 50-d m.a. because it has slipped to its lowest level since August.
To calculate the percentage correctly, use this formula:
(New Highs � New Lows) / (New Highs + New Lows) * 100 = X%
Below is an updated look at the weekly averages for the NH-NL Ratio:
Saturday, January 14, 2006: 500-32
Saturday, January 21, 2006: 348-46
Saturday, January 28, 2006: 516-46
Saturday, February 4, 2006: 449-44
Saturday, February 11, 2006: 229-57
Saturday, February 18, 2006: 306-42
Saturday, February 25, 2006: 420-36
Saturday, March 04, 2006: 399-49
Saturday, March 11, 2006: 162-84
Saturday, March 18, 2006: 459-53
Saturday, March 25, 2006: 312-52
Saturday, April 01, 2006: 441-39
Saturday, April 08, 2006: 481-58
Saturday, April 15, 2006: 150-103
Saturday, April 22, 2006: 540-75
Saturday, April 29, 2006: 353-76
Saturday, May 6, 2006: 503-74
Saturday, May 13, 2006: 384-116
Saturday, May 20, 2006: 64-211
Saturday, May 27, 2006: 57-182
Saturday, June 3, 2006: 119-93
Saturday, June 10, 2006: 72-204
Saturday, June 17, 2006: 41-310
Saturday, June 24, 2006: 56-238
Saturday, July 01, 2006: 127-198
Saturday, July 08, 2006: 143-95
Saturday, July 15, 2006: 74-273
Saturday, July 22, 2006: 66 – 307
Saturday, July 29, 2006: 163-151
Saturday, August 5, 2006: 194-132
Saturday, August 12, 2006: 88-210
Saturday, August 19, 2006: 178-96
Saturday, August 26, 2006: 140-74
Saturday, September 2, 2006: 285-42
Saturday, September 9, 2006: 143-60
Saturday, September 16, 2006: 244-75
Saturday, September 23, 2006: 206-83
Saturday, September 30, 2006: 251-75
Saturday, October 7, 2006: 301-92
Saturday, October 14, 2006: 412-40
Saturday, October 21, 2006: 442-29
Saturday, October 28, 2006: 480-40
Saturday, November 4, 2006: 251-57
Saturday, November 11, 2006: 388-48
Saturday, November 18, 2006: 541-55 – most new highs in 2006 (weekly average)

Piranha
 Theorists make money selling books that sell fear while investors and entrepreneurs make money by following their ideas with money and hedging against a possible crisis. I learn from history and history shows us that these “crisis” books will always sell during tough times. Readers eat up this garbage because most people are trapped in the rat race working their asses off just trying to stay afloat. Their attitudes are typically piss-poor and they love to read about huge negative events (especially a crash that may hurt others).


Connect with Me