Archives for 2006

Tuesday’s MSW Daily Screen

Since I posted my first completely positive (longs only) screen last night (in November), I decided to share it with everyone on the blog. I still view the market as extended but it is trending higher and until that trend is snapped, shorting stocks will carry risk (at least shorting them the way I do � following the O�Neil approach from his book on shorting). I will post a list of stocks with charts tomorrow that show similar characteristics to the ones highlighted in O�Neil�s book on shorting.

Many of the market�s leading stocks powered higher Tuesday including several MSW Index members such as:
LVS, ICE, ISE, LRCX, JLL

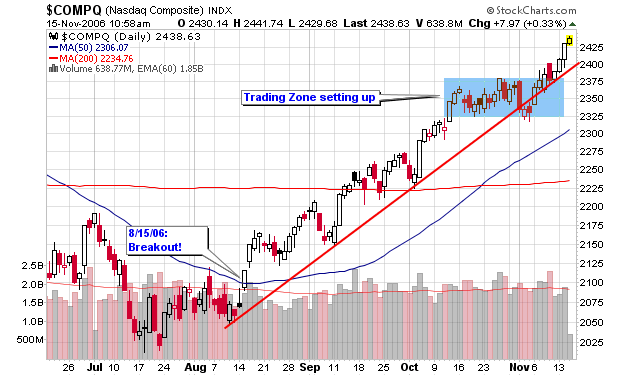
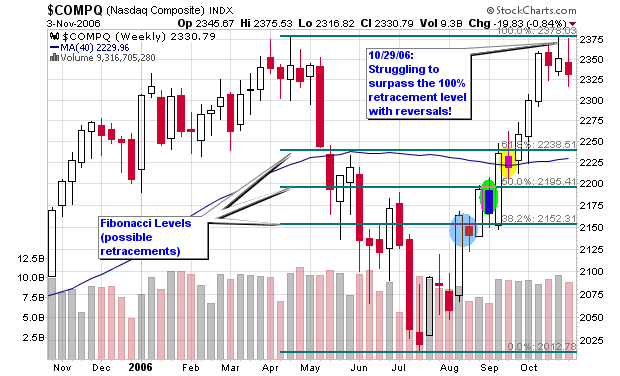
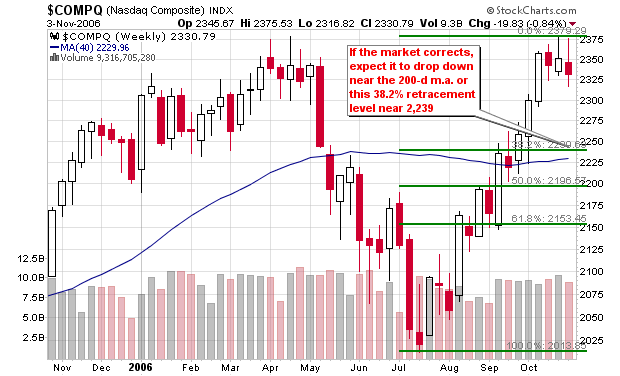
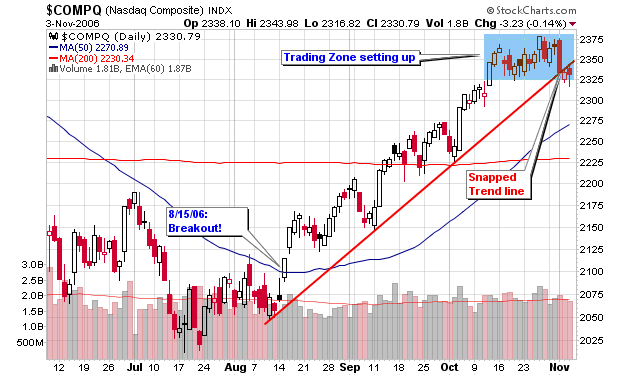
As explained below, a couple of these MSW Index stocks clearly vaulted past their pivot points which were highlighted on the weekly screen over the weekend. The NASDAQ is now up 1.71% for the week and is far above the former 100% retracement level that was established back in April 2006. If you pull out on the charts and look at a two year weekly view of the NASDAQ, you will see the deep v-shaped pattern with handle and pivot point breakout to new highs (the highest point since 2001). The NASDAQ daily chart clearly shows how the index is climbing along the trend-line I have highlighted in red. Remember, I have been screening shorts over the past several weeks but none of the major indexes have reversed the trend even though they are all extended. Until the trend snaps, we must tread carefully when placing shorts. Due to the extended nature of the market, we must also tread carefully when placing longs or adding shares to current positions.

All major indexes moved higher in above average volume as the recently weak retail sector decided to take some leadership. Looking at my charts through the link below, we can see that small caps are gaining strength versus their larger cap peers. Along with these small caps, many growth stocks are starting to come to the head of the class and flex their muscle just as IBD stresses in tonight�s eIBD edition. IBD mentions how the S&P 600, the small cap index, is within 1% of an all-time high. One of the most impressive numbers of the day was the NH-NL ratio finishing at 613-71 as advancing issues beat declining issues (6,314 to 3,657).

REMEMBER THE �M� IN CANSLIM!
Current Environment: Short term plays (long or short)! The market is extended but trending higher.

Interesting Stocks making New Highs:

  • ICE � 96.55, the MSW Index stock blasted 9.10% higher today on big volume and now has a 31% gain on MSW since 9/23/06. I called for a new buy above $88 this past weekend
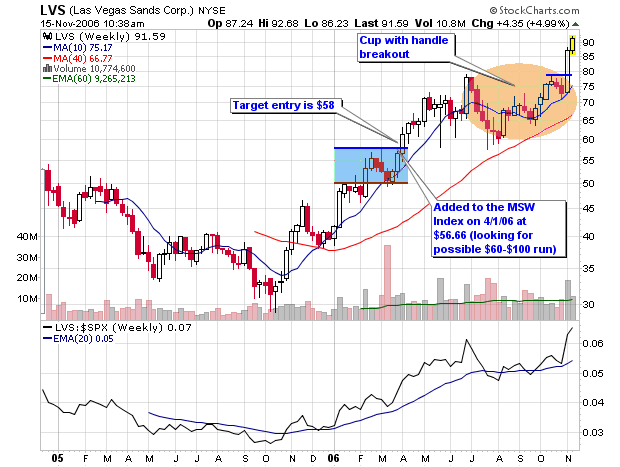
  • LVS � 92.00, up another 4.75% today for a 62% gain on the MSW Index since April of this year. The stock is now up almost 30% in the past two weeks. Now in the final stage of the $60-$100 run (lock in all gains above $89 or 75% of the run)

  • TM � 124.82, a six month cup shaped pattern that should form a handle before grabbing new shares. Toyota was screened daily several times near the 200-d m.a. above $100 earlier this year
  • NTY � 33.19, a double top breakout on the P&F chart on above average volume (a 12.32% gain today)
  • EDU � 31.85, an interesting young stock that is trending higher that may be entering extended territory. The support/resistance zone stands at $28
  • CTSH � 79.55, a gap-up to new highs that almost erased during the day before trending higher during the afternoon. The ideal trend buy is still near the 50-d m.a.
  • GROW � 39.64, now up over 8% this week as the stock continues to make new highs. �stocks that make new highs typically continue to make new highs until the major trend is snapped�.
  • NICE � 32.58, the second consecutive gap-up for a total weekly gain of 9.18%. The previous triple top breakout took the stock from $29 to $33 which now acts as the ceiling for the potential double top breakout
  • LRCX � 55.04, up 3.36% today for a total weekly gain of 9.86% on above average volume. The stock blasted past our pivot point of $52.53 and is now up 21.42% on the MSW Index since 9/30/06
  • CTRP � 58.88, the former MSW Index stock is making new highs after becoming a 200-d m.a. play last month. It is up over 20% since mentioned as a 200-d m.a. play in October.

Interesting Stocks within 15% of New Highs:

  • FFIV � 72.07, a very deep seven month base without a handle formation at this point in time. An ideal pivot point will develop after the proper handle formation
  • WCG � 62.20, a trading range between $57 and $64 will determine a buy or sell but note that some heavy distribution weeks cast a dark cloud near new highs
  • ISE � 50.49, the stock has formed the handle to the long term cup shaped base and has a pivot point of $55.23 and support above the 50-d m.a. Up over 4.51% for the week and up almost 17% on the MSW Index
  • TWGP � 33.56, the former MSW Index stock is back above the 50-d m.a. on strong volume. The 200-d m.a. is still the long term support and the up-trend indicator
  • ININ � 18.75, the stock is approaching the $20 level which typically acts as resistance when making new highs so be careful not to chase it into extended territory
  • RVSN � 21.20, a nine month cup shaped base that has completed the right side as it is within cents of the 52-week high (the left side of the base). Look for a handle to form with a pivot point before grabbing shares
  • HWCC � 23.78, a double top breakout has setup on the P&F chart with a short term entry above $25

Piranha

How the Poker Craze can Help you Trade

111006_poker_craze.png

As promised, I have uploaded the excerpt of my article from the latest edition of The Trader’s Journal.

The article explains on the basis of position sizing and expectancy and how poker has made me a better trader.

How the Poker Craze can Help you Trade

Wall Street Journal Online Mention

I noticed that my traffic was up today but the source was new:
The Wall Street Journal Online edition.

I was mention by David A. Gaffen in the Market Beat section at 10:30am this morning. Market Talk with Piranha (now ChrisPerruna.com) was added to the box “Blogs We’re Reading” at online.wsj.com. I am honored to be mentioned by such a large publication and thank David for following my analysis. I also want to thank Yaser for the screenshot!

110606_wsj_hghlght.png

Market Snapshot

I will start with the NASDAQ and will focus on the Fibonacci Retracement chart as the Index is having trouble moving through the 100% retracement level. The index has reversed from highs over the past three weeks but did not flash distribution (as a week) this past week. The NASDAQ has flashed four distribution days over the past month which is enough to signal a major market reversal according to CANSLIM rules.


One could also view the weekly chart of the NASDAQ as a deep six month V-shaped pattern with a handle formation. As humans, we can’t argue which chart is correct (the Fibonacci or V—shaped) so we must focus on signals and trade according to those signals. If the market breaks out above the handle, it is telling us to place long positions just as it is giving us the green light to place shorts or buy put options with a continued Fibonacci reversal.

Take a look at the second Fibonacci chart provided which shows where the NASDAQ may reverse if it can’t regain its footing. The logical area would be near the 200-d moving average which is also near the first 38.2% retracement level of 2,239. This same area also serves as the original drop back in May 2006 near the 200-d m.a. Nothing is guaranteed but the signals and setups are there so trade them and cut a loss if you are wrong. It’s not very difficult.


Please remember that Fibonacci retracements are still secondary indicators when compared to price and volume; so don’t make your ultimate decision on a secondary tool. The daily chart of the NASDAQ still shows a trading zone between 2,325 and 2,375 as highlighted in blue on the charts provided. The trend line was snapped as the index is moving sideways with the recent distribution days. Price and volume along with several secondary indicators now point down for the NASDAQ.


The DOW has gained more than 12% over the past four months with an almost straight-up pattern without many breathers. The index reversed from its highs two weeks ago and dropped 0.86% last week on below average volume. The S&P 500 is following the same pattern as it too trades near all-time highs but the weekly down volume continues to come on less than average volume. I have added a Fibonacci graphic on the DOW chart to give you an idea where this tool believes the market will correct. Ironically, the first 38.2% retracement level sits exactly where a handle should have formed before the index moved higher (according to CANSLIM setups).


Other secondary indicators that tell us that the market wants to move lower is the NH-NL ratio which has weakened considerably for the first time in five week as new highs dropped below an average of 300 per day for the first time since late September as new lows have increased to their highest total in a month. We had 688 new highs and only 46 new lows two weeks ago Thursday but had a completely different story told this past Thursday with only 148 new highs and 87 new lows. That’s a 78% decrease in new highs and a 90% increase in new lows. Subtle clues like this can and will paint the picture of what’s going on with the strongest stocks in the market (the leaders). I use the NH-NL ratio as my number one secondary indicator and actually consider it my 1a indicator since it has proven to be so reliable after basic price and volume.


Another indicator is the percentage of stocks trading above their 50-d moving average which spent the past several weeks in overbought territory but has dropped considerably over the past five days (down 13.40% for the week). It took the NASDAQ three months to reverse after this specific indictor gave its signal earlier in the year but the market wasn’t climbing at the extreme angle it is today. It only took the market one month to reverse to the up-side after this indicator gave the over sold indicator in June. Look at the charts page and focus on the light purple line that is plotted behind the chart to see when the NASDAQ was making its move up and down in 2006.


Crude oil is still trading in the range highlighted on the weekly chart and is actually showing more weakness but I have been saying that the elections would probably hold the price down. Gold broke out successfully above the triangular formation that I highlighted last month on the weekly chart and was up over 4.5% for the week as it is trading back at its highest level in two months.


Piranha

Published for the First Time

I am proud to say that I will be published for the first time next week in a magazine titled:
The Trader’s Journal

“Asia Pacific’s Pre-eminent Trading Magazine is a product of DPR International Pte Ltd based in Singapore and distributed to Hong Kong, Malaysia, and Australia. Our primary focus is to research and educate you. It can be easily argued that it is the educated trader that will survive in the markets and we want to be a large part of your education.

The publisher, Dickson Yap, has a long history in the industry. Prior to launching the Trader’s Journal magazine, he worked in the Dow Jones Singapore office doing advertising and circulation. His businesses serve thousands of customers around the world in every time zone.”

Some very prominent authors, traders and educators have contributed and still contribute to the magazine so I am honored that they published my article. Here are some of the names you may be familiar with:

Van Tharp
In the unique arena of professional trading coaches and consultants, Van K. Tharp stands out as an international leader in the industry. Helping others become the best trader or investor that they can be has been Tharp’s mission since 1982. Dr. Tharp offers very unique learning strategies, and his techniques for producing great traders are some of the most effective in the field. Over the years Tharp has helped people overcome problems in areas of system development and trading psychology, and success related issues such as self-sabotage. http://www.iitm.com/

Tom Bulkowski
Thomas Bulkowski is an author and private investor. Before earning enough from his investments to “retire” at age 36, he was a hardware design engineer working at Raytheon on the Patriot air defense system and a senior software engineer for Tandy Corporation. http://mysite.verizon.net/resppzq7/

John F. Carter

John F. Carter grew up the son of Morgan Stanley stockbroker, and was introduced into trading as a sophomore in high school, and has been trading actively for the past 19 years. He studied international finance at the University of Cambridge in England before graduating from the University of Texas at Austin. In 1999, he launched www.tradethemarkets.com to post his daily trade setups in futures and equities. More recently he launched www.razorforex.com to focus on forex trading research and trading strategies. He’s a Commodity Trading Advisor with Razor Trading, and manages a futures and a forex fund.

Brett N. Steenbarger

Brett N. Steenbarger, Ph.D. is Associate Clinical Professor of Psychiatry and Behavioral Sciences at SUNY Upstate Medical University in Syracuse, NY and author of The Psychology of Trading (Wiley, 2003). As Director of Trader Development for Kingstree Trading, LLC in Chicago, he has mentored numerous professional traders and coordinated a training program for traders. An active trader of the stock indexes, Brett utilizes statistically-based pattern recognition for intraday trading. http://www.brettsteenbarger.com/

NOTE:
Brett has just released his latest book which I have not read (yet) but have provided a link since he will also be published in the November issue of The Traders Journal.
Enhancing Trader Performance: Proven Strategies From the Cutting Edge of Trading Psychology (Wiley Trading) (Hardcover)
by Brett N. Steenbarger
http://traderfeed.blogspot.com/2006/10/finding-your-performance-niche.html

Price Headley
Price Headley is the founder of BigTrends.com, which provides investors with specific real-time stock and options strategies and investment education to profit from significant market trends. He has appeared on CNBC, Fox News, CNNfn, Bloomberg Television and a variety of print and online financial news outlets, including The Wall Street Journal, Barron’s, Forbes, Investor’s Business Daily, USA Today, and Bloomberg Personal. http://www.bigtrends.com/

Jim Wyckoff
Jim Wyckoff has been involved with the stock, financial and futures markets for more than 20 years. He was born and raised in Iowa, where he still resides. Wyckoff became a financial journalist with Futures World News for many years, cutting his teeth as a reporter on the futures trading floors in Chicago and New York, where he covered every futures market traded in the United States at one time or another. http://www.tradingeducation.com/

Robert W. Colby
Robert W. Colby is managing director of Colby Research in New York and the author of The Encyclopedia of Technical Market Indicators, which has become the standard reference work throughout the world for technical indicators and trading systems design http://www.tradingeducation.com/

For a complete list of contributors, visit their site: http://www.traders-journal.com/issues/contributors.html

p.s. – So what am I writing about?
How the Poker craze can Help you Trade
It’s a 2,800 word article that compares the detailed similarities between trading and poker which have helped me become better at both. I will upload the entire article to this blog after it has been released in the magazine.