The markets gave us 2,952 new lows last week, surpassing the previous multi-year weekly low of 2,862 set in the final week of July 2007. The NH-NL ratio dropped to its worst level in more than five years with a weekly reading of minus 86.89%.
Last week averaged 41 new highs per day and 590 new lows per day with the ultimate apex coming on Thursday with a daily reading of 33-1,276. I can’t even find a reading of minus 94.96% in my data which stretches back to the post bubble days. Thursday is now the weakest reading my data has ever recorded (keep in mind that I started to store this data in excel back in 2001 so I am sure it is not the worst ever or even the worst reading over the past 10 or 20 years).
See a Historical chart (1968-2007) here for the Lowest Hi-Low Differential in Nine Years
*click the image for a larger view*

The past four weeks have compiled new lows of 2,862, 2,646, 2,095, and 2,952 for a monthly average of 2,639; comparatively, May had an average of 450 or one sixth the number of stocks making new lows over the past month.
We recorded our first reading of more than 1,000 new lows on Monday August 6, 2007 after writing this very popular post:
A Negative New High – New Low Ratio (NH-NL)
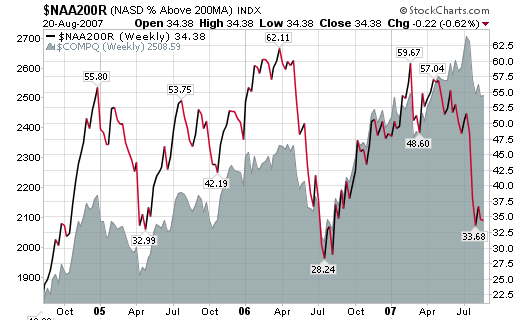
The NH-NL Ratio remained in negative territory for nine of thirteen weeks in the spring and summer of 2006 while the NASDAQ corrected from 2,300 to 2,000. If that is any indication of what the market wants to do now, be prepared to watch the market tread sideways to slightly lower over the next few months. Yes, the Fed is screwing with the natural progression of the market by bailing out Wall Street’s mistakes but all things reach their equilibrium sooner or later.
So what does this all mean?
As I said in my last NH-NL Ratio post:
It means that the market should be ready to correct by “another” 10% based on the history of my NH-NL studies.
In addition to watching the NH-NL Ratio, I keep an ongoing database with the movements of the 197 industry groups tracked by Investor’s Business Daily. Unfortunately, I can’t reproduce that proprietary information here as they will be sending me e-mails warning me to take it down as it is for subscribers only (it has happened before). However, I can list the general industries that are gaining and losing steam over the past couple of weeks as this information can be compiled anywhere on the web.
The industries on the move happen to be retailers with emphasis on:
- Consumer Electronics
- Drug Stores
- Super Markets
- Wholesale Food
Aside from Retailers, Banks are also on the rise since the Fed made their move.
Groups taking the worst hit over the past few weeks include Machinery (tools, metal related groups, construction, general) and Transportation (Rail, Airlines, Equipment Manufactures).
Looking at this final chart, we can see the year-to-date gains/losses for the following industries:
$XOI – OIL 10.35%
$TRANQ – TRANSPORT 8.06%
$SOX – SEMIS 5.18%
$HCX – HEALTH CARE 1.10%
$RLX – RETAILERS (6.97%)
$DRG – DRUGS (3.89%)
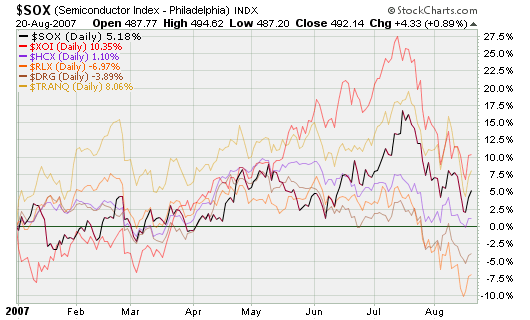
Transports were up 19% in July before giving back half their gains over the past few weeks. The same is true for oil and semis (giving back almost two thirds of their gains in one month).
Weekly New High – New Low Ratio (NH-NL) for 2007:
Saturday, January 6, 2007: 279-67
Saturday, January 13, 2007: 344-39
Saturday, January 13, 2007: 281-46
Saturday, January 27, 2007: 316-55
Saturday, February 3, 2007: 502-45
Saturday, February 10, 2007: 558-53
Saturday, February 17, 2007: 428-48
Saturday, February 24, 2007: 556-42
Saturday, March 3, 2007: 187-130
Saturday, March 10, 2007: 96-125
Saturday, March 17, 2007: 114-145
Saturday, March 24, 2007: 284-53
Saturday, March 31, 2007: 227-68
Saturday, March 31, 2007: 227-68
*April is excluded as I was in Hawaii – sorry*
Saturday, May 5, 2007: 418-86
Saturday, May 12, 2007: 387-72
Saturday, May 19, 2007: 367-129
Saturday, May 26, 2007: 428-73
Saturday, June 2, 2007: 535-63
Saturday, June 9, 2007: 291-80
Saturday, June 16, 2007: 271-116
Saturday, June 23, 2007: 326-104
Saturday, June 30, 2007: 180-146
Saturday, July 7, 2007: 438-97
Saturday, July 14, 2007: 492-152
Saturday, July 21, 2007: 426-217
Saturday, July 28, 2007: 142-572
Saturday, August 4, 2007: 85-529
Saturday, August 11, 2007: 168-524
Saturday, August 18, 2007: 41-590


Chris,
If you connect with Carl Swenlin at DecisionPoint.com you should be able to get longer term charts on the NH / NL ratio you mentioned.
Carl’s email is DPService@decisionpoint.com.
All the best,
Mike
Thanks Mike,
I’ll reach out to him about data for the NH-NL ratio prior to 2001.
Thank you for all your insightful info, it is greatly appreciated. Your one of my favorite blogs, Thanks again
Chris, this was a great read man, solid post.
Chris,
I have spent many hours reading and studying your blogs; best on the web! I am very anxious to see your new site. In the meantime, I have a question about relative strength. I have a mild understanding of relative strength based on my own research but can you explain RS in more detail especially the meaning and importance of RS numbers and how they fit into an investor’s strategy. For me, your post on January 22, 2006 that looks at Coach (COH) and Tower Group (TWGP) would be a good place to begin.
Thank you. Keep up the good work.
Paul Trombley
I just came across this.
“So what does this all mean?
As I said in my last NH-NL Ratio post:
It means that the market should be ready to correct by “another” 10% based on the history of my NH-NL studies.”
I guess this was written on Aug 21st or thereabouts?