I wrote an article on October 15, 2007 titled How to Make Money Selling Short, precisely when the general market indexes were topping. I am not going to take full credit but subconsciously my charts were giving me signals that the market was showing the major red flags and signals of what we are seeing today. This is a direct quote from that blog post from three months ago:
I have (privately) screened several potential shorts over the past couple of months but this market is not ready to roll over just yet. I was early with my shorting analysis in 2006 so I do not want to make the same mistake in 2007. However, more and more stocks seem to be building bases like the ones from the bubble burst in late 1999 and early 2000 (examples in the charts provided).
When I short stocks, I look for longer term trends, not short term swing trades (rarely ever day trades). The shorts I want look like the charts in this post (they take months or even years to complete). I want the high flyers that will be crushed over the next several months. Just as I like riding trends higher, I like riding trends lower over the intermediate to long term (4-12 months). I am trend trader at heart and it is what I do best.
We will have bounces to the upside over the next few months and the Fed will try to stop the bleeding but the stocks that are due for crushing blows will be dealt those blows eventually and we all can profit from them. Stocks may move 20%-50% (in both directions) at times so be careful. I will spend the remainder of the week posting up charts that look ready to become long term losers. Charts similar to the examples below. Give the charts time to form, be patient because many of these will look to move higher at times (as soon as this week and next) prior to their inevitable fall.
Complete Blog Post Repeated from October 15, 2007:
The title of the post is borrowed from the book “How to make Money Selling Stocks Short” by William J. O’Neil. It’s an ideal book for investors that focus on trading longer term trends and don’t necessarily do this for a profession (i.e.: day traders).
The book contains some excellent strategies for finding prime shorting candidates or stocks that are about to enter a declining stage that may offer excellent risk/reward setups for buying put options.
(CLICK FOR LARGER IMAGES)

I consider several of the techniques in the book to be reverse CANSLIM? Study the charts from the past that have setup ideal shorts and then screen for those same characteristics in stocks trading today. Many of the ideal shorts from past market declines have held the reverse characteristics of an ideal CANSLIM stock (that you would want to buy).
Many traders believe that the most obvious area to place a short would be near the peak of stock’s trading range but studies have found this to be untrue.

Characteristics of Longer Term Trend Shorts
- Most ideal longer term “trend” shorts take four to twelve months after the peak price to setup on the weekly chart with the majority of these shorts triggering between six to nine months.
- Look for stocks that had prior up-trends and support levels that can now act as downward resistance or entry areas.
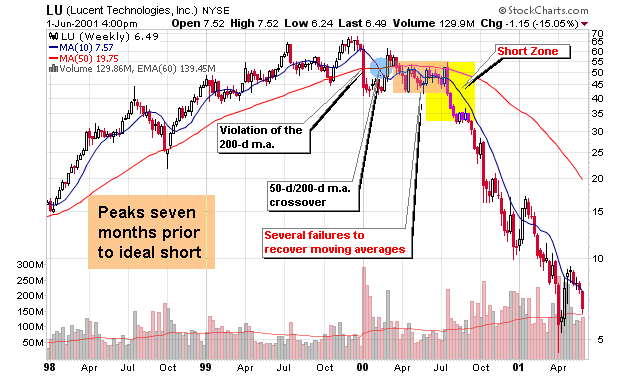
- Once a stock tops and starts to consolidate, you want it to slice through the 50-d moving average and then the 200-d moving average.
- A crossover between the 50-d m.a. and the 200-d m.a. is ideal and is graphically presented on each chart in this post
- The odds of success increase with each failed attempt for the stock price to recover these major long term moving averages.
- Head and shoulder tops can also serve as ideal setups for potential shorts if they take at least five months to develop.
- A decreasing relative strength line and a negative pattern on the point and figure chart can also confirm that the stock is rolling over and setting up an ideal short.
- Finally, volume should be increasing and the stock should be under distribution as it violates the major moving averages and starts to break former support levels.
No one knows when this market will roll over so study the ideal characteristics now so you are prepared to recognize them when they appear. I have (privately) screened several potential shorts over the past couple of months but this market is not ready to roll over just yet. I was early with my shorting analysis in 2006 so I do not want to make the same mistake in 2007. However, more and more stocks seem to be building bases like the ones from the bubble burst in late 1999 and early 2000 (examples in the charts provided). Until this market turns, I will not be posting up short candidates to the blog as I am not a market top predictor.
This bull could go on for another year – who’s to argue that? Do you have a crystal ball?
As the chart examples show, numerous shorting opportunities will appear giving the longer term trend trader adequate time to enter a position (no need to rush).

For further reading, see my two part article on shorting and the book by O’Neil – the charts alone are worth the price times 10!
Shorting Stocks – The Basics, Part I of II
Shorting Stocks – The Basics, Part II of II
I also recommend:


Notice how the stocks dropped by as much as 50% from their peaks and then gained most of it back before the ultimate fall and true shorting opportunity. Keep that in mind with the leaders falling today. They may be losing 20%, 30%, 50% or more but buyers will jump in and support them. The ideal shorts may be months away. We’ll watch together over the next several months (if these setups actually form).
Thanks for the insight you offer. I look forward to seeing what you come up with. Your ideas are usually great and always give me something to tweak my strategies with. Thanks again
How about the short ETF’s you posted some months back (such as DOG, DXD, SDS, MYY and MZZ). Is it too late to begin taking positions in these???
Charts for the Big Bounce bounce that’s developing: (http://benbittrolff.blogspot.com/2008/01/charts-for-big-bounce.html)
TheFinancialNinja
Might also want to consider shorting into this kind of pattern:
http://timothysykes.com/index.php/myblog/a-few-recent-examples-of-the-sykes-pattern.html
as everybody and their mother knows, it’s made me millions. fade the spike!
Jacap,
The inverse ETF’s closed yesterday with gains of 13.42%, 15.43%, 22.31% and 18.76%. PSQ has the 22.31%. It looks late to get in now for proper risk/reward but don’t forget about them. I may do a post about these again tonight.
They have been excellent performers since I wrote about them : http://www.chrisperruna.com/2007/10/17/inverse-etfs/
Any tips in O’Neil’s book on how to avoid the pitfall of thinking you’re jumping on a strong downtrend when in fact you’re just going short at the bottom?
The charts above are a bit misleading because they come from the Bubble Years, which a look at any 25-year chart of the S&P500 will show were truly extraordinary (especially for tech and I-Net stocks) and, thus, not representative of what the average person may encounter.
With that said, the 50-day SMA on the S&P500 crossed below the 200-day SMA just before X-mas, and we all know what’s happened since. Sometimes, though, by the time that’s happened all the air has already been let out — because MA’s are lagging indicators.
chris II,
I don’t agree with what you say and I will highlight this over the next few months if in fact the market does fall further. The patterns might look more drastic due to the bubble but they also occured in 2004 and 2005 when stocks took breathers and will appear again if the market heads lower this year. Human nature.
I am not looking for day trading shorts. I started to profile the fall of CROX near $70 and then again at $55. The 50-d crossed the 200-day at $40. The stock is now at $29, another 25% lower and it may drop further.
Look at SHLD – 50-d crossed the 200-d at $170 in July (short there). It now trades at $90-$99. If that’s lagging, sign me up!!!
Chris, many IBD 100 stocks in the early to intermediate stage of rolling over.
I posted 14.
Undoubtably there will be more spikes before they really give up. However, I still think there is room for short swing trades.
Woodeshedder,
Nice list! I’ll have to check it out further for one that may hvae longer term setups as well (or at least the beginning stages of that pattern).