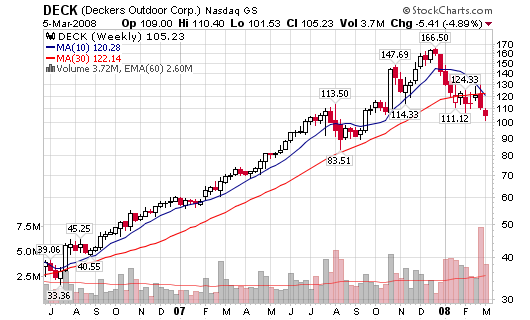
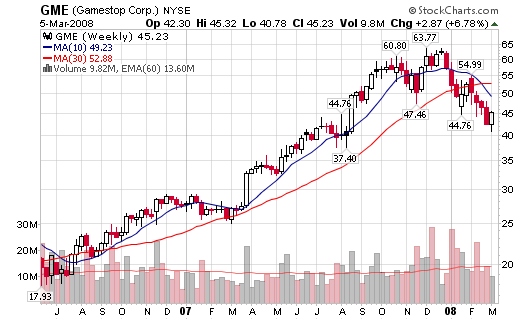
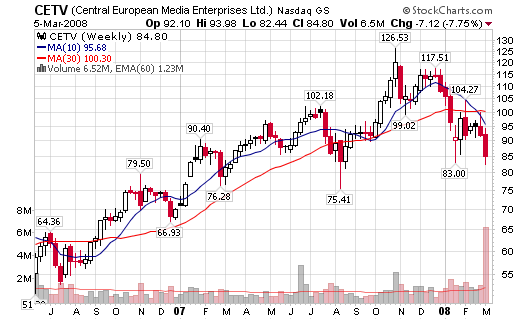
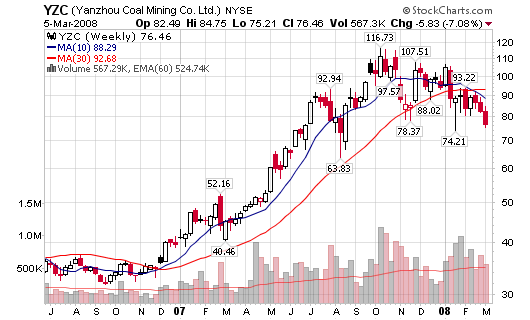
In keeping with last night’s theme, I will highlight five stocks that are trending downward on above average volume after reaching 52-week highs within the past six months.
Tonight’s stock charts show a declining 10-week moving average that is now trading below the 30-week moving average. The 30-week moving average is just starting to point downward in most of these charts. Trader Vic wrote in his book:
- “When the 10-week moving average crosses the 30-week moving average and the slope of both average is down, this comprises a sell signal, provided prices are below both moving average line”
- “Of course, as with all technical observations, these observations are never right 100% of the time.”
- “The biggest mistake anyone can make in using moving averages, or any technical observation for that matter, is to fall in love with it”
With that said, I will admit that I love using the 10-week/30-week indicator when looking for longer term trend changes and buy/sell signals.
Tonight’s stocks include:
DECK – 105.23 – hat tip to Mike in comments
GME – 45.23
CETV – 84.80
YZC – 76.46
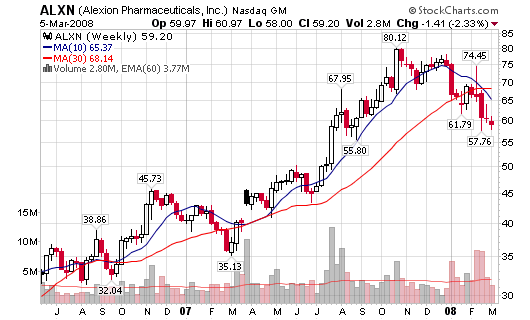
ALXN – 59.20


Hey Chris,
Just wondering if you will take positions on most of these? I also am new to shorting, so could you tell me if theres a way to put a stop limit or the equivalent on a short stock? Or do you just let the price fluctuate up to 20-50% like you said could happen? just looking for some clarification! thanks. according to your analysis, many of these look like very prime candidates soon right?
cheers
mike
On several occasions I have had the chance to communicate with Vic. He is a very, very smart guy. More renaissance man than stock trader. He has a new book out:
http://www.amazon.com/Trader-Vic-Commodities-Misunderstood-Trading/dp/0470102128/ref=sr_1_2?ie=UTF8&s=books&qid=1204840287&sr=1-2
He is one of my trading advice heroes [after Chris ;>)) ]
Chris, are you waiting on a pullback, if there ever is one, to initiate short positions in some of stocks mentioned? I’m sure you’ve already mentioned it before, but what timeframe do you usually use for entry on stocks above. Thanks.
mikemo,
I short on failed attempts to recover the moving averages, especially the 30-week or 200-d moving averages. Use stops just as you do on the long side. Cover when it is violated.
George,
I look for failed attempts to recover moving averages (30-week and 200-day). The larger the volume, the better on a failed attempt and reversal from the moving average.
zenprofit,
I’d love to hear about how you have met/ communicate with Trader Vic. That is one trader I would love to meet, probably top 5 on my list!
Thanks for the book mention, I will check it out as he always has something great to say.
Chris: In terms of the 10/30 week moving average crossover, is it relevant in all time frames (6 month chart) or primarily the 2 year chart as you’ve shown on the website. thanks much. — ron
Is the 30 week Moving average the same as the 200 day, if not how do you determine the 30 week? Thanks