I am going to start an occasional monthly post that highlights a stock that falls within the definition of a value stock but acts more like a growth stock. Berkshire Hathaway could be the ideal pick for the debut of this type of research but I am going to start with a company that structures itself in a similar fashion, Leucadia National Corporation (LUK).
I will also be looking into stocks such as BRK/A, SHLD, BAM and some of the recent banking stocks that may be undervalued (now and in the near future).
Value Stock of the Month
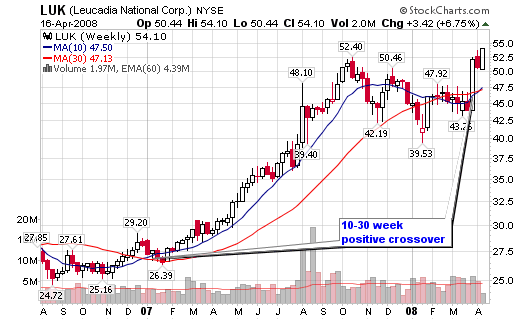
Leucadia National Corp. (LUK)
Wednesday’s Closing Price: LUK – $54.10
Sector: Financials
Industry: Multi-Sector Holdings
52-week Price: $30.01 – $54.10
Leucadia is a diversified holding company that has subsidiaries engaged in manufacturing, real estate, medical product development, gaming entertainment, mining, and energy. Does this remind you of Berkshire? Leucadia is known, by some, as a “mini Berkshire Hathaway” with an average annual return of over 22%.
By the way, BRK/A is currently trading along the 200-d m.a. for the first time since last summer ($110k per share). It closed today at $129,475 after reaching a 52-week high of $151,600 in December (a 14% slide). Chart at bottom of blog post.
Leucadia executives Ian Cumming and Joseph Steinberg each own about 13% of Leucadia’s shares and practice a methodology similar to that of Warren Buffett. A $10,000 investment 5 years ago in LUK is worth $43,029 today.
Leucadia has a strong record of stock market performance due to its strategy of finding assets and companies that are out of favor or troubled and are therefore selling at a discount to their inherent value.
The stock just made a new 52-week high after using the 200-d m.a. as support while giving us a 10-week/30-week moving average crossover to the upside. My ideal accumulation area is near (slightly above or slightly below) the 200-day moving average (currently near $46). In hindsight, late 2006 and early 2007 was the “true’ ideal time to buy before the latest run. However, I should have listened to my old friend Kevin Pickell and grabbed shares years ago.
I was completely off on my timing of SHLD back in May 2007 so I may not be that bright when it comes to value companies but it’s time to start a new portfolio for my family that isn’t so young/fast time growth oriented (especially when people are running scared). SHLD will be my next value stock to research as it looks to be entering an area where accumulation is appealing.

Potential Trade Set-up:
Ideal Entry: $45 (low $40 range is better)
Risk is set at 3.0% of total portfolio or $3,000 of $100k
Stop Loss is 25% or $33.75
Number of Shares: 267
Position Size is $12,000
Risk is $11.25
Target is not material (value play)
*Notice the unusually large stop loss and risk versus trading a growth stock.*
Institutional Analysis:
Total Held by Institutions: 691
Money Market: 328
Mutual Fund: 349
Other: 14
New Positions: 142
Positions Sold: 55
Shares Held: 180M
Shares Held Previous Period: 174.9M
Shares Bought: 16.2M
Shares Sold: 10.2M
Value of Shares Bought: $729.4M
Value of Shares Sold: $462.5M
Top Institutional holders; Shares Held:
Horizon Asset Management, Inc.; 22,086,165
Kinetics Asset Management Inc.; 12,212,376
Fairholme Capital Management; 8,832,992
Beck, Mack & Oliver; 7,700,775
First Manhattan Company; 7,391,364
Key Fundamental Numbers:
Market Cap.: 11.4B
Shares Outstanding: 222.6M
Total Revenue: $1.2B
Profit Margin: 43.53%
52Wk Change: 66.30%
Earnings Growth (5yr): 17.87%
Rev. Growth (TTM): 33.87%
PE (TTM): 25.34x
ROA: 7.49%
ROE: 10.16%
1-yr EPS Rate: 259%
1-yr Sales Rate: 60%
EPS Growth (MRQ): 141.96%
Revenue Growth (MRQ): 72.49%
Net Income (millions):
FY 2007: 484
FY 2006: 189
FY 2005: 1,636
FY 2004: 146
FY 2003: 97
Revenue (millions):
FY 2007: 1,155
FY 2006: 862.7
FY 2005: 1,041
FY 2004: 2,262
FY 2003: 556.4
Earnings:
FY 2007: $2.09
FY 2006: $0.60
FY 2005: $5.35
FY 2004: $0.70
FY 2003: $0.46


HI Chris, welcome back. I was wondering why do you prefer the use of the 40 MA (instead of 50 or 30 , as in the 10-30). Thanks.
Hi Chris,
I have Excel, but I’m not good at it.
Is there a possibility you could write or add to your existing Position Excel files the capability to enter in the newest sticker price of a stock a person owns and how much you wish to add to that position.
The answer would show the new total of shares and new average price. It would be a “What If’ scenario.
Thanks Chris.
Rich
Just wanted to add… It’s very difficult to analzye a company like this from a earnings/revenue/growth perspective. They have a large securities portfolio, and they are also rich in assets which may not be appreciated on the balance sheet. There may be a lot of value that is difficult to quantify. Plus…what value do you place on the jockey(Joe Steinberg and Ian Cumming) versus the horse(the business)? In my opinion, the jockey is worth a bunch…as is Buffett with Berkshire, and Lampert with Sears Holdings. So in essence, this is a ‘jockey’ play as much as anything else. When I first bought my shares, this was a 4 billion dollar company. It is now approaching 12 billion market cap.
Rafael,
The 40-week m.a. on a weekly chart is basically the 200-d moving average.
Rich,
I am not sure I follow what you are asking for?